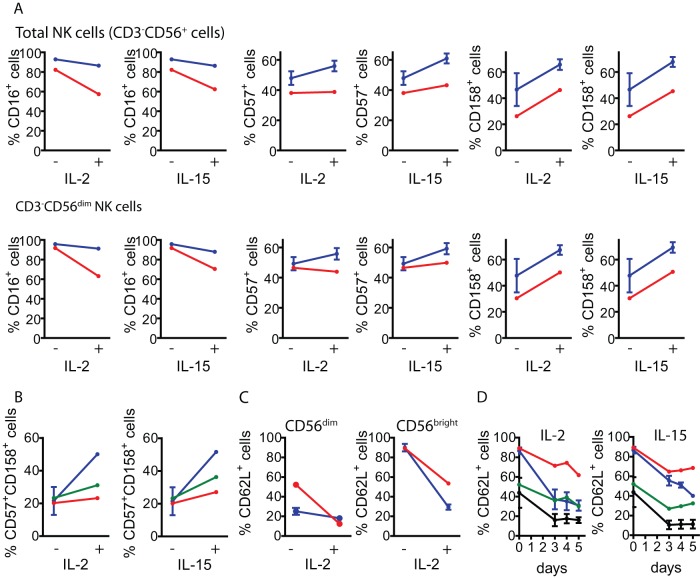
Figure 6. Percentage of CD16+, CD57+, CD158+ and CD62L+ NK cells before and after stimulation with IL-2 or IL-15.
A) Percentage of CD16+, CD57+ and CD158+ cells before (−) and after stimulation of PBMCs with IL-2 or IL-15 (+) in total NK cells (CD3−CD56+ cells, upper line of graphs) and in CD56dim NK cells (lower lane of graphs) from healthy normal donors (blue) and from the patient (red). B) Percentage of CD57+CD158+ cells before (−) and after stimulation of PBMCs with IL-2 or IL-15 (+) in total NK cells (CD3−CD56+ cells) and in CD56dim NK cells from the same samples. Blue: NK cells from healthy donors; red: NK cells from the patient; green: CD3−CD56dim NK cells from the patient. C) Percentage of CD62L+ cells before (−) and after stimulation of PBMCs with IL-2 (+) in CD3−CD56dim cells and in CD3−CD56bright cells from the same samples. Blue: CD3−CD56+ cells from healthy donors; red: CD3−CD56+ cells from the patient; green: CD3−CD56dim cells from the patient. D) Percentage of CD62L+ cells before (0) and after 3 to 5 days of stimulation of PBMCs with IL-2 (left graph) or IL-15 (right graph) in CD3−CD56dim and CD3−CD56bright NK cells from healthy donors and from the patient. Black: CD3−CD56dim cells from healthy donors; green: CD3−CD56dim cells from the patient; blue: CD3−CD56bright cells from healthy donors; red: CD3−CD56bright cells from the patient. Six healthy donors samples were used for analysis of CD16 and CD57; two healthy donor samples were used for analysis of CD158, CD57 and CD62L expression. One representative experiment from 3 independent analyses is shown. PBMCs from blood samples obtained in December 2007 were used.

