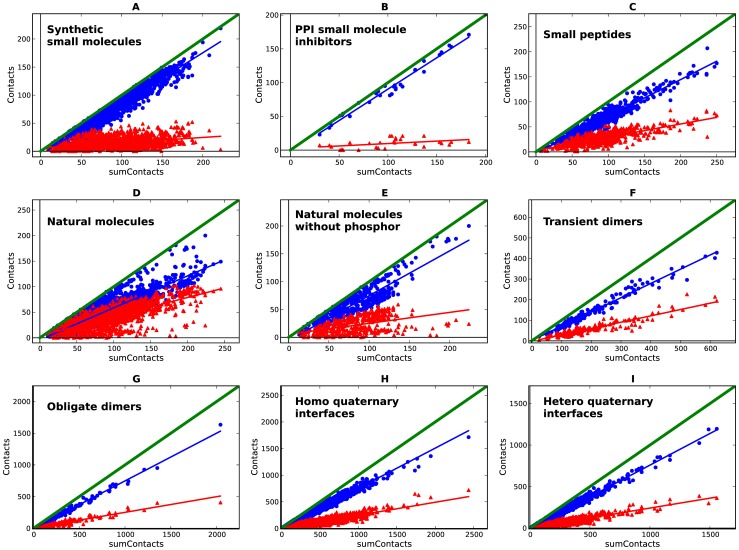
Figure 1. Scissors plots for the non-redundant-by-complex (Table S2) sets of protein complexes.
a: synthetic small molecules bound to proteins; b: protein-protein interactions small molecule inhibitors bound to proteins; c: small peptides bound to proteins; d: natural small molecules bound to proteins; e: natural small molecules not containing phosphorus bound to proteins; f: transient protein-protein dimers; g: obligate protein-protein dimers; h: homo protein-protein interfaces from quaternary structures; i: hetero protein-protein interfaces from quaternary structures; polar (red) and apolar (blue) contacts are scattered against sum of contacts.

