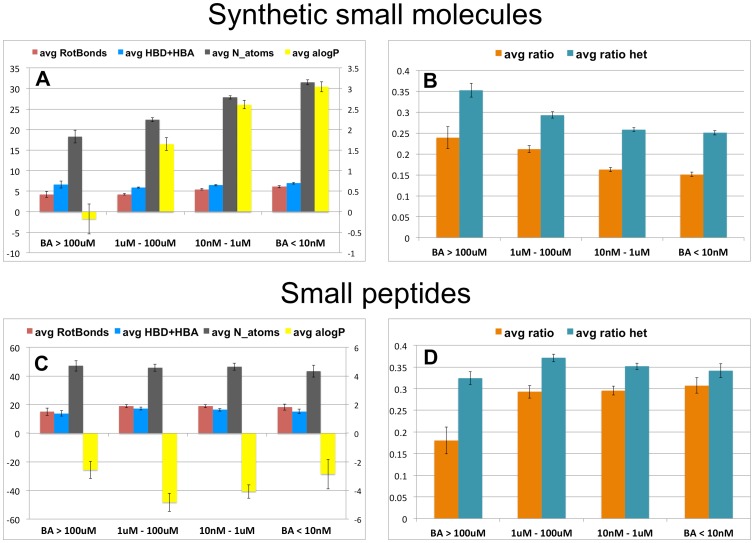
Figure 5. Binding affinity versus interaction profile.
Binned binding affinity (BA) data for synthetic small molecules (A and B) and for small peptides (C and D). Bars in (A) and (C) denote the average of molecular properties for each affinity bin: rotatable bonds (red), sum of hydrogen bond donors and acceptors (blue), number of atoms (black) and AlogP (yellow, in the secondary right axis scale for clarity). Bars in (B) and (D) denote the average of polar ratio (orange) and the average heteroatom content (cyan). Error bars are the standard error of the mean.

