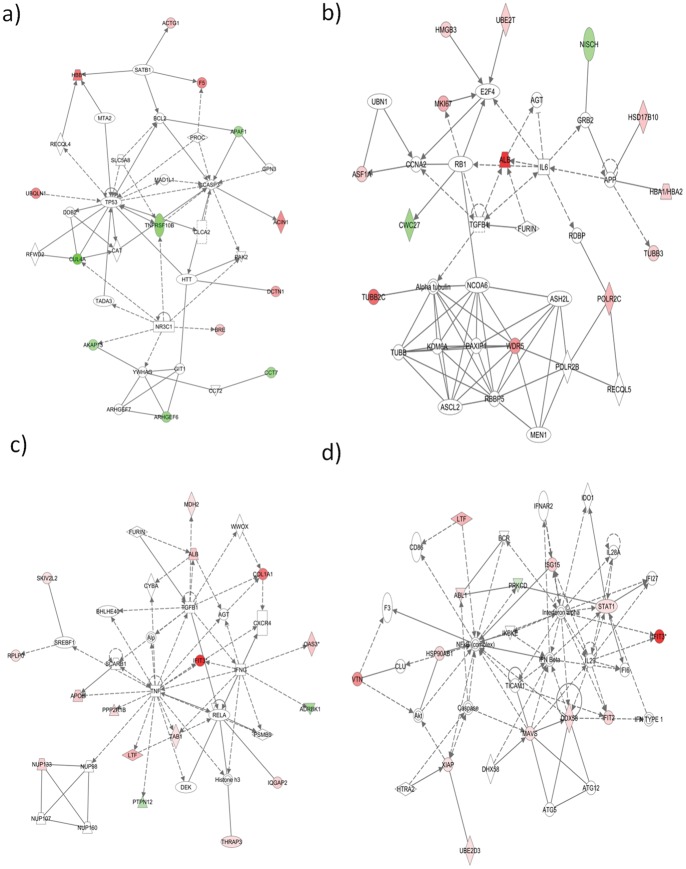
Figure 6. Functional network analysis of differentially regulated proteins observed in T1L infected HEK293 cells at 6hpi (a, b) and 24hpi (c, d).
The top network functions identified in the previous figure are shown in more detail with interconnecting protein relationships indicated by solid (direct interaction) or dashed (indirect interaction) lines. Red/pink molecules represent proteins up-regulated; green molecules represent down-regulation. (a) Network 1, 6hpi; top functions include cell death (b) Network 2, 6hpi; top functions include cellular growth and proliferation. (c) Network 1, 24hpi; top functions include molecular transport. (d) Network 4, 24hpi; top functions include infectious disease and inflammatory response.

