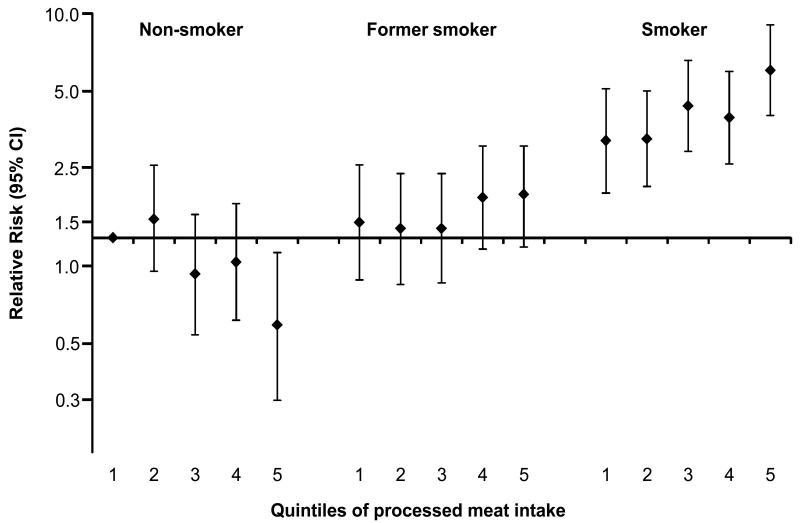
Figure 1. Cross-classification of smoking and processed meat intake.
Multivariable-adjusted relative risks and 95% CI for the joint effect of processed meat intake and smoking status on the association of upper aero-digestive tract cancer in EPIC. RRs were adjusted for sex, energy from fat and non-fat sources, education, alcohol intake, BMI, physical activity, intake of citrus and non-citrus fruits, and vegetables, red meat, and poultry (non-smoking participants in the lowest category of processed meat intake constitute the reference group). Note that the RRs (Y axis) are plotted on a logarithmic scale.

