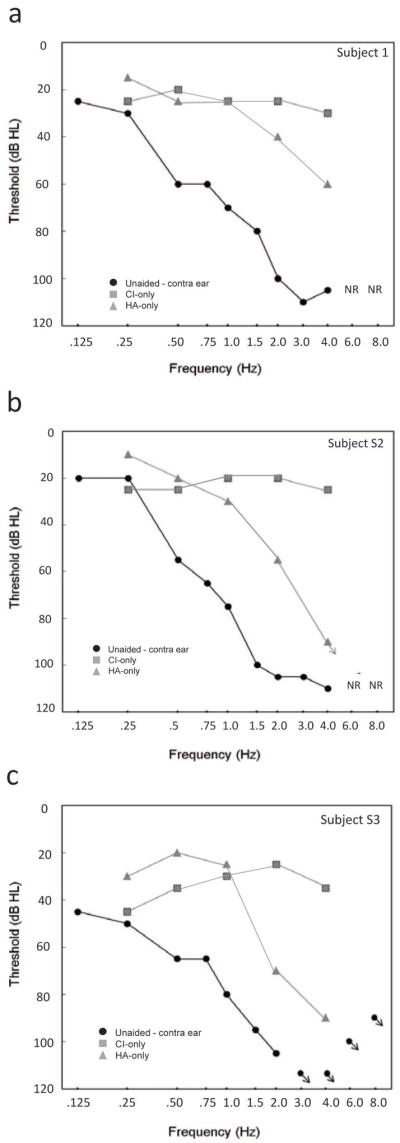
Figure 1. Aided and unaided audiometric thresholds for subject S1.

A. Subject S1. B. Subject S2. C. Subject S3. Frequency is shown along the x-axis from 0.125 to 8.0 kHz and threshold is shown (in dB HL) along the y-axis. Unaided thresholds obtained using insert earphones in the contralateral ear are shown by the filled circles. Aided sound field thresholds for the CI are indicated by the squares, and for the hearing aid, by the diamonds.
