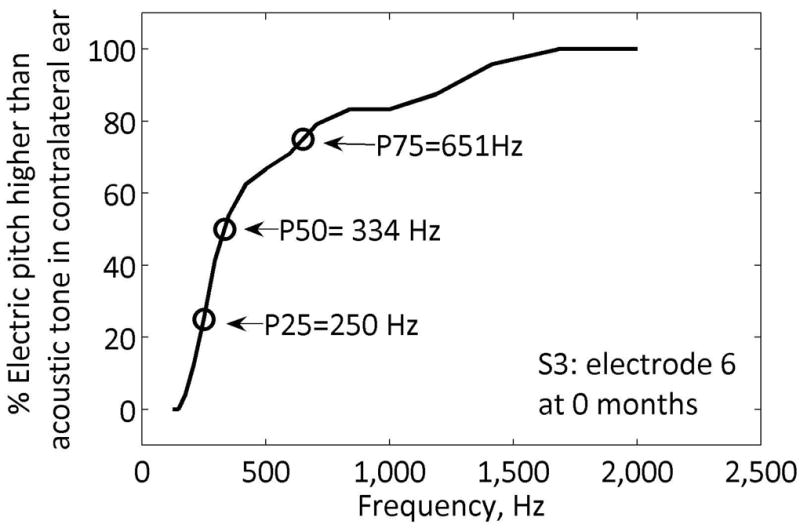
Figure 2. Example acoustic-to-electric pitch match for a cochlear implant electrode.

The percentage of responses for which the electric pitch was higher than the acoustic tone pitch is plotted versus tone frequency. Arrows indicate the 25%, 50%, and 75% points.
