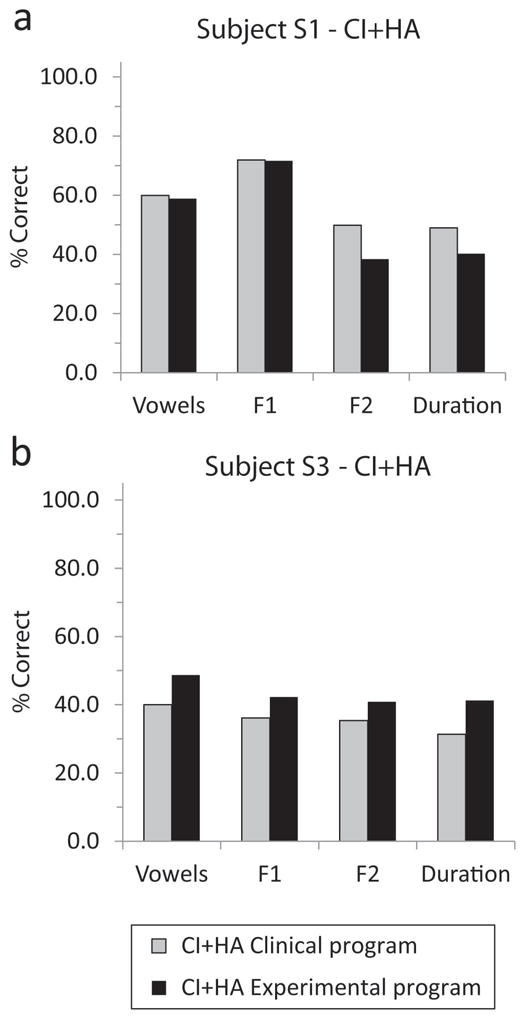
Figure 6. Vowel recognition results compared for the clinical and experimental maps for subjects S1 and S3.

Each panel shows vowel and individual feature (F1, F2, and duration) scores for each subject and condition. Gray bars indicate the clinical frequency allocation and black bars indicate the experimental frequency allocation. Subject S1 scores are shown for CI+HA in (a) and subject S3 scores are shown for CI+HA in (b).
