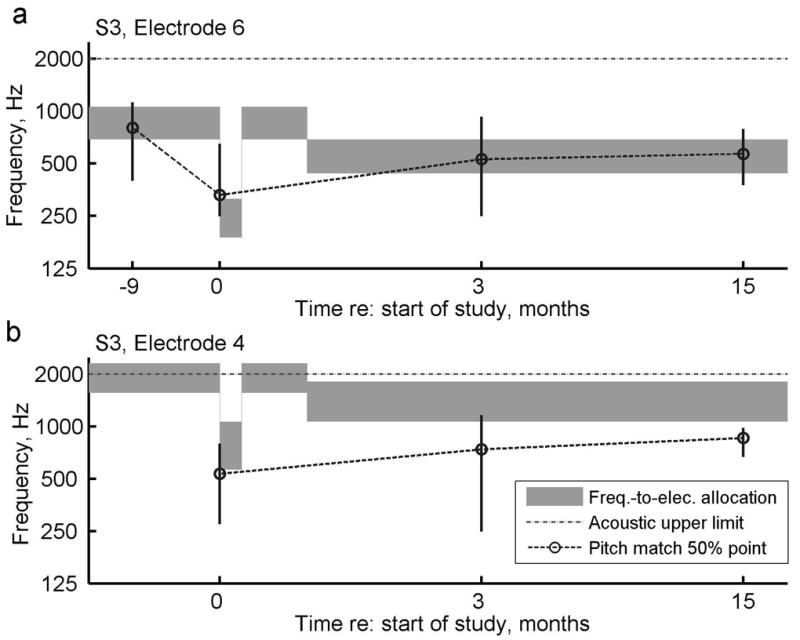
Figure 9. Pitch match results for subject S3 over the duration of the experiment.

a. Pitch changes over time for electrode 6. b. Pitch changes for electrode 4. For reference, pitch matches from 9 months prior to the study and 15 months after starting the study are also shown when available. Circles indicate the center or 50% point of the pitch-match range, vertical lines indicate the 25-75% range, and dashed lines indicate pitch match trends over time. Gray bars indicate the frequency-to-electrode allocations for comparison. Dotted gray lines indicate the upper frequency limit of the acoustic hearing.
