Figure 3.
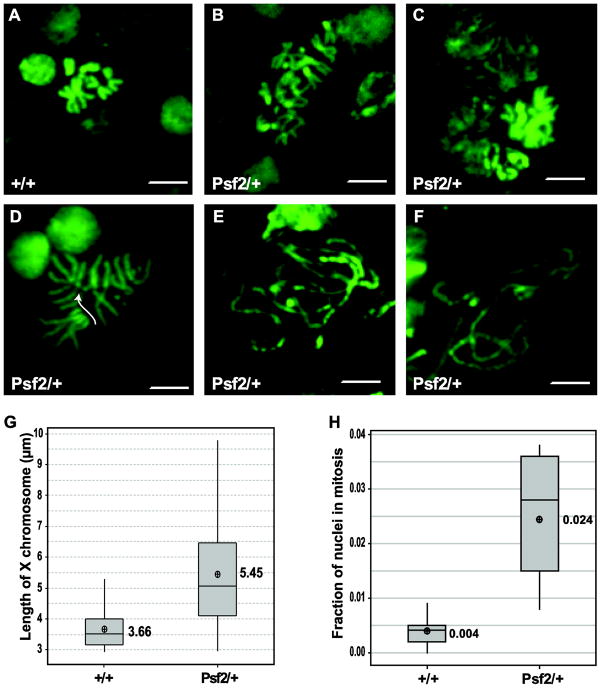
Effects of reduced dosage of Psf2 on mitotic figures in larval brains. (A) Representative micrograph of wild-type mitotic figure. (B–F) Representative micrographs of mitotic figures from Psf2/+ brain squashes showing a variety of defects including aneuploidy (B, C, D), severely mis-condensed and broken chromosomes (E, F), and premature sister chromatid separation (D arrow). (G) Quantitation of mitotic indices of Psf2/+ and wild-type. Psf2 heterozygotes show significant M phase delay compared to wild-type (p= 0.004). (H) Quantitation of X chromosome length in Psf2/+ and wild-type. X chromosome are significantly longer in Psf2/+ larval brains than in wild-type (p<0.000). Scale bar = 10μm

