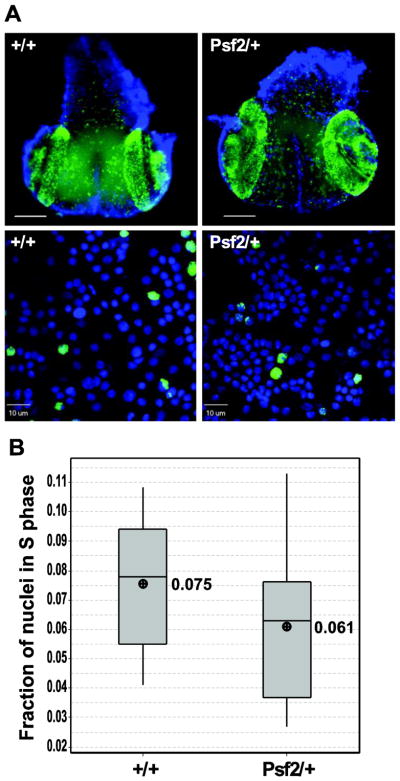
Figure 5.
Larval brains from Psf2/+ do not show significant S phase delay. (A,Top) Micrographsof whole mount wandering 3rd instar larval brains showing DNA stained with DAPI (blue) and EdU incorporation (green). (A, bottom) Representative micrographs of squashed third instar wandering larval brains showing individual nuclei stained with DAPI (blue) and EdU incorporation (green) used for quantitation of S phase indices. (B) Graph showing the fraction of nuclei in S-phase from the genotypes indicated. There is no significant (p=0.204) difference in the fraction of cells in S-phase in Psf2/+ compared to wild-type. Scale bar = 10μm

