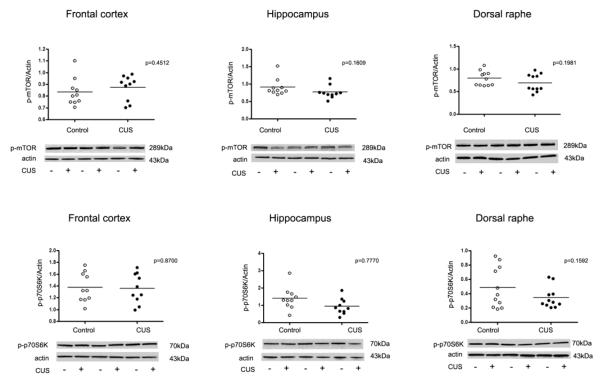
Fig. 5.
Scatter plots of phosphorylated mTOR and p70S6K protein levels normalized to actin. No significant changes in phospho-mTOR and phospho-p70S6K were observed in the frontal cortex, hippocampus and dorsal raphe (filled circles; n=10) as compared to controls (open circles; n=10). Normalized optical density values for the individual subjects and mean values (horizontal lines) are presented.

