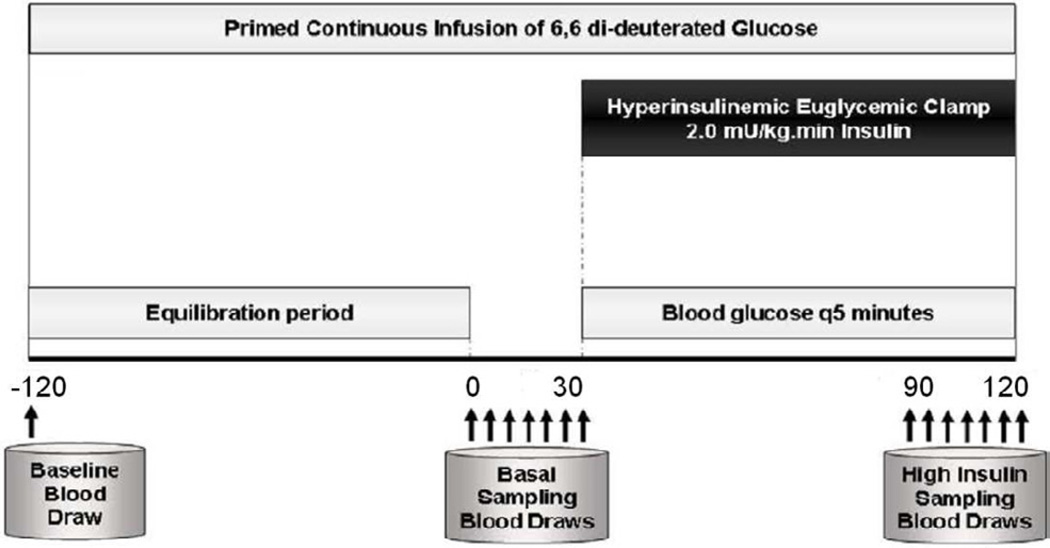
Figure 2.
Schematic diagram of the Hyperinsulinemic Euglycemic Clamp (HEGC) Procedure. Arrows denote time points for blood draws. A primed continuous infusion of human regular insulin (50 units/50 ml of normal saline) was started at a rate of 2.0 mU/kg/min and maintained at that level through 120 minutes. Glucose was maintained at baseline (+/− 5 mg/dl) throughout the clamp procedure (−120 to +120 minutes). The glucose disposal rate during steady state was calculated over the last 30 minutes (M-value).

