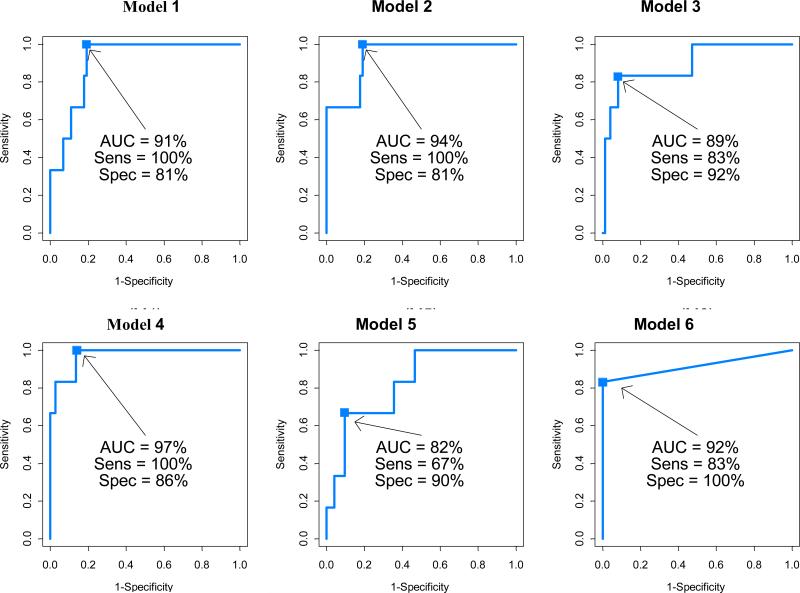
Figure 1. Receiver operating characteristic (curves of detecting moderate/severe NCD based on the performance scores of select Ped-ANAM subtests.
AUC: area under the receiver operative characteristic curve (ROC); Sens: sensitivity; Spec: specificity
Model 1: ROC curve from Model1 using stepwise selected AC measures;
Model 2: ROC curve from Model2 using stepwise selected CVc measures;
Model 3: ROC curve from Model3 using stepwise selected MNc measures;
Model 4: ROC curve from Model4 using stepwise selected AC, CV and MNc measures;
Model 5: ROC curve using the model developed in pilot study; ref (11);
CART model: Score defined as 1 if CPT CV>0.6; 2 if CPT CVc≤0.6 but M2S CVc>1.4; 3 if CPT CVc ≤0.6 and M2S CVc≤1.4 but CPT MNc≤375; and 4 if CPT CVc ≤0.6 and M2S CcV≤1.4 but CPT MNc <375.

