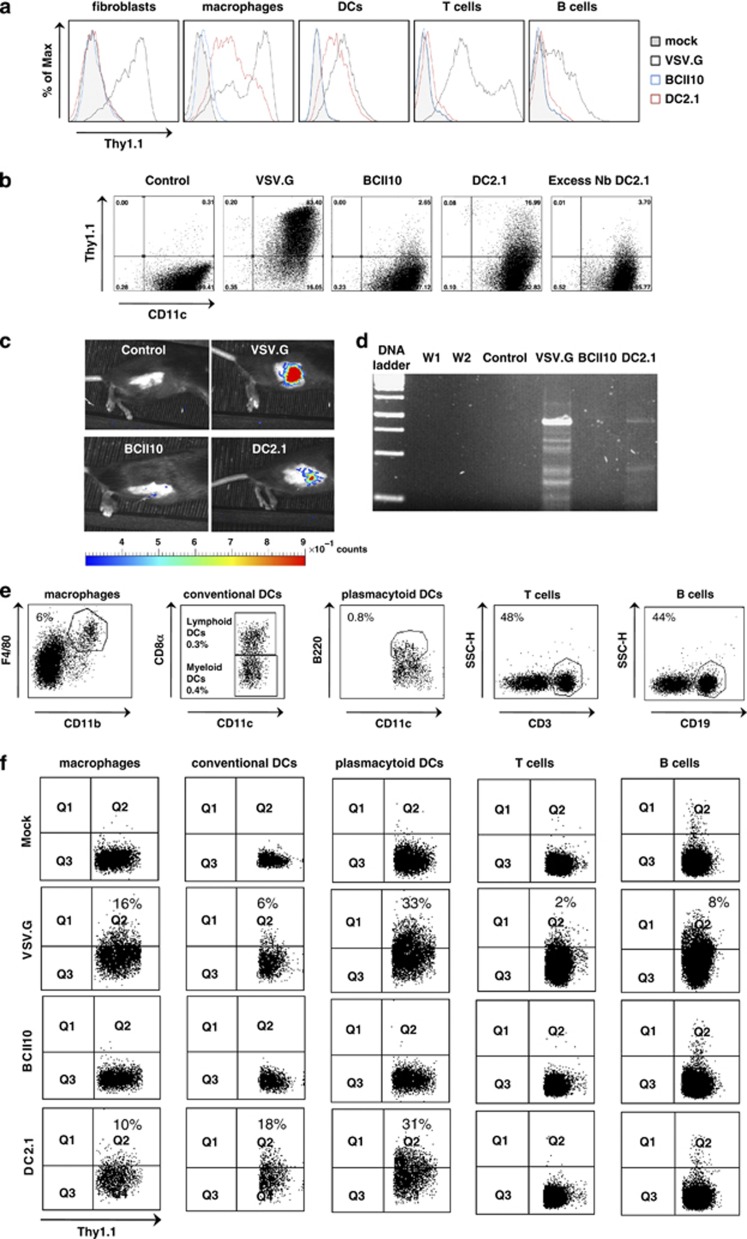
Figure 2.
Selective transduction of mouse DCs and macrophages by Nb DC2.1 displaying LVs. (a) Mouse NIH 3T3 fibroblasts, A20 B lymphoma and EL4 T lymphoma cells, RAW 264.7 macrophages and bone marrow-derived DCs were mock transduced or transduced with VSV.G pseudotyped or Nb BCII10 or DC2.1 displaying LVs (multiplicity of infection 10). Flow cytometry was performed 72 h later to evaluate transgene, Thy1.1, expression. The histograms demonstrate Thy1.1 positivity in the evaluated cell types. The tinted, blue, black and red histogram, represent mock transduced cells or cells transduced with Nb BCII10 displaying LVs, VSV.G pseudotyped LVs or Nb DC2.1 displaying LVs, respectively. One representative experiment is shown (n=3). (b) Mouse bone marrow-derived DCs were pre-incubated with an excess of Nb BCII10 or DC 2.1, after which these were transduced with Thy1.1 encoding LVs displaying the respective Nbs. Expression of Thy1.1 was determined 72 h later. The dot plots demonstrate the Thy1.1 expression by DCs upon mock transduction (control), transduction with VSV.G pseudotyped LVs, LVs displaying Nb BCII10 or DC2.1 when pre-incubated with Nb BCII10 or DC2.1. One representative experiment is shown (n=2). (c) To evaluate the targeting strategy in vivo, we first administered 105 TU of FLuc encoding LVs to the inguinal LN of C57BL/6 mice. In vivo bioluminescence imaging was performed 36 h later to obtain bioluminescent pseudo-color images, in which high luminescence (a measure for the amount of FLuc positive cells) is shown in red and weak luminescence in blue. The color scale underneath the images represents the LUT or Look up Table, and correlates the luminescence to an absolute amount of counts (light units). The pseudo-color images were superimposed on gray-scale photographs of the mice (n=3). (d) To confirm transduction, hence, proviral integration in the genome of LN cells, we performed a nested PCR on the genomic DNA isolated from these LNs. Subsequently, the PCR fragments were separated using a 1.2% agarose gel. Lanes 1–7 depict the 1 kb DNA ladder, water control of the first (W1) and second (W2) PCR, and the PCR amplification products of genomic DNA isolated from LNs injected with VSVG pseudotyped LVs or LVs pseudotyped with VSV.GS and displaying Nb BCII10 or DC2.1 (n=3). (e, f) LVs encoding Thy1.1 were administered (106 TU) to the inguinal LN in order to track LV transduced cells. Analyses were performed 36 h later on single cell suspensions prepared from these LNs. In order to evaluate Thy1.1 expression in macrophages, myeloid DCs and lymphoid DCs (together conventional DCs), pDCs, B and T cells the LN cells were stained with the antibody directed against Thy1.1 in combination with antibodies directed against CD11b F4/80, CD11c CD8α, CD11c CD8α, CD11c B220, CD19 and CD3, respectively. The dot plots in (e) depict the cell populations of which the Thy1.1 expression is shown in the graphs in (f). One representative experiment is shown (n=3).

