
Figure 2.
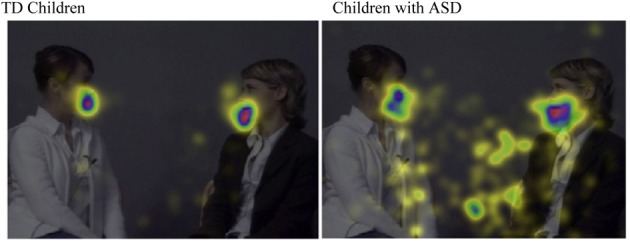
The mean relative duration of fixations on the different parts of the display during the conversation. The durations of fixation are calculated from a group of TD 3-years-old children (n = 12) and a group of 3–6-years-old children with ASD (n = 9). The increasing amount of fixations on a specific part of the display is depicted in yellow-green-blue-red color where red corresponds to the most fixations. It can be seen that the fixations of the children with ASD are more scattered than the fixations of the TD children. In addition, the fixation highlights show that the children with ASD have a strong tendency to fixate the shadow casted by the right model. When she spoke, she tended to move her head a little and the shadow of her head attracted the gaze of the children with autism but not the TD children (From von Hofsten et al., 2009, RASD, by permission).