
Figure 3.
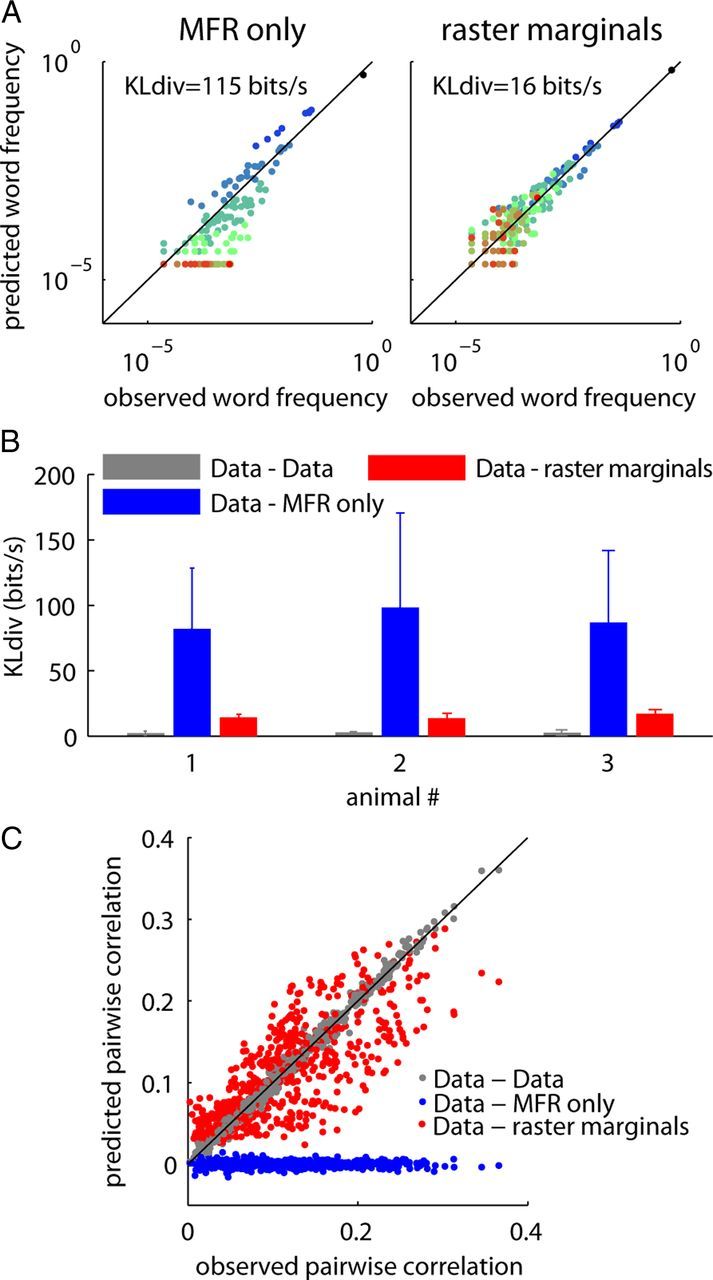
The raster marginals model accounts for the word distribution observations in rat A1. A, Fit between the MFR and raster marginals models to the word distribution in epoch S2 of Figure 1C. B, Summary data for the fit of the MFR and raster marginals models to the word distributions in the eight conditions in each animal (six in one of the rats). The bars represent the mean KLdiv. Error bars indicate SD. The gray bars indicate the KLdiv between two halves of the experimental data. C, The fit of the MFR and raster marginals models for the pairwise correlations (across all the conditions and animals). The gray points show how well the pairwise correlation measurement from one half of the experimental data describes the second half.