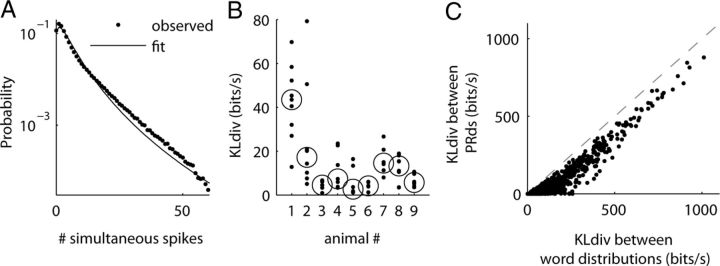
Figure 6.
Statistical properties of the PRd. A, Example of a shifted lognormal fit to PRd of activity in one block from cat V1 dataset. In this particular example the KLdiv between the actual PRd and the fit is 20 bits/s. B, The KLdiv between the shifted lognormal fit and the observed PRd for each one of the blocks. Circles indicate the median KLdiv for each animal. In eight of the nine animals PRd is well described by a shifted lognormal distribution. C, KLdiv of word distributions is bounded from below by KLdiv of PRds. The panel shows the relationship of the KLdiv between word distributions of different blocks and the KLdiv between the corresponding PRds. As in Figure 5D, we use the 200 available pairs of blocks, with five different (random) selections of 16 of the 96 electrodes, for a total of 1000 points. Note that all points are to the right of the equality line, indicating a strict lower bound.

