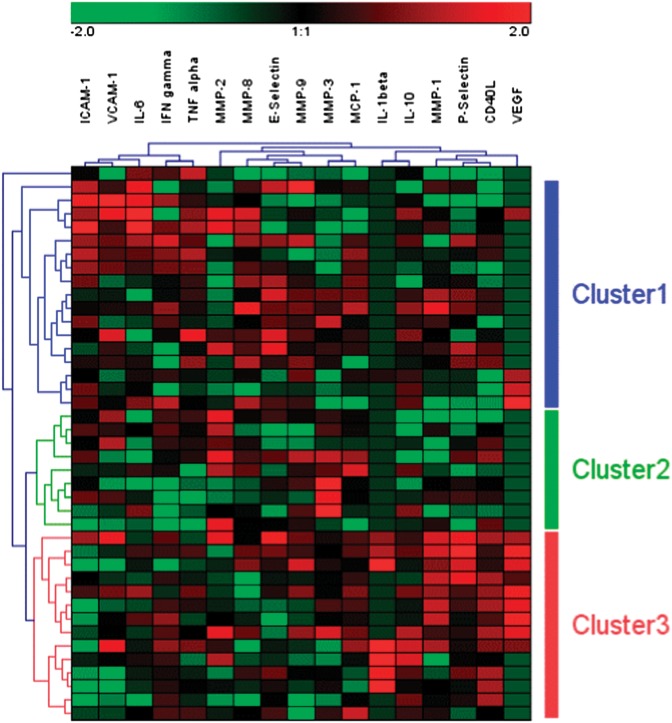
Fig. 2.
Plasma concentration profiles of 17 biomarkers in 41 patients expressed as a HCA heat map. Plasma concentrations of biomarker close to higher and lower than the mean values are represented by black, red and green colours, respectively. Three patient clusters, Cluster 1 (blue bar), Cluster 2 (green bar), Cluster 3 (red bar) and one outlier are generated by HCA.

