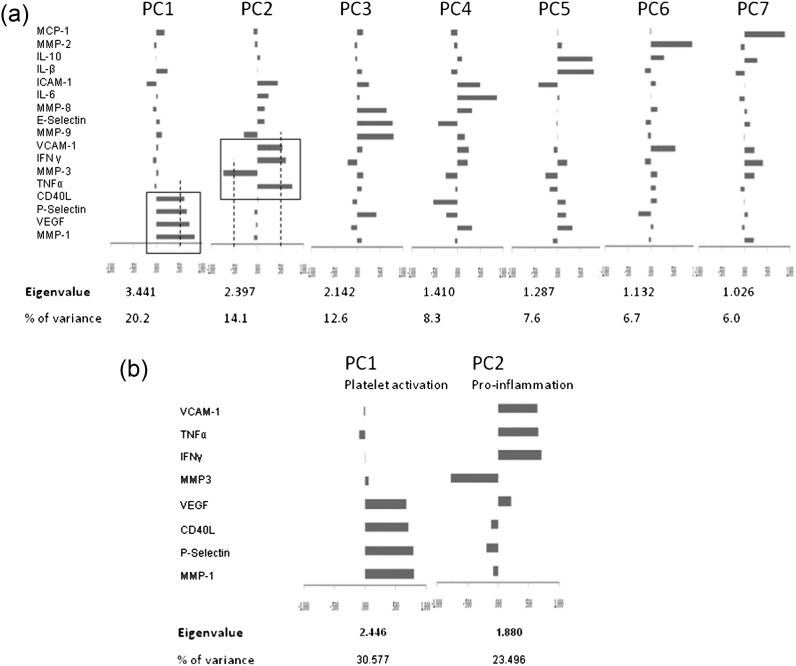
Fig. 3.
(a) PCA from the whole panel of the 17 biomarkers eigen values and percentage contributing to the total sample variance of each of the seven PCs is presented. Individual composition feature is showed along with their rotated loading coefficients, a measure of the importance of each biomarker to the factor, displayed as a bar chart. (b) PCA from reduced number of biomarkers. The eight biomarkers that compose the two strongest PCs, contributing the majority of the total sample variance are selected for the final PCA. The composition of the 2 PCs derived from the final model is displayed along with their rotated loading coefficients expressed as a bar chart.

