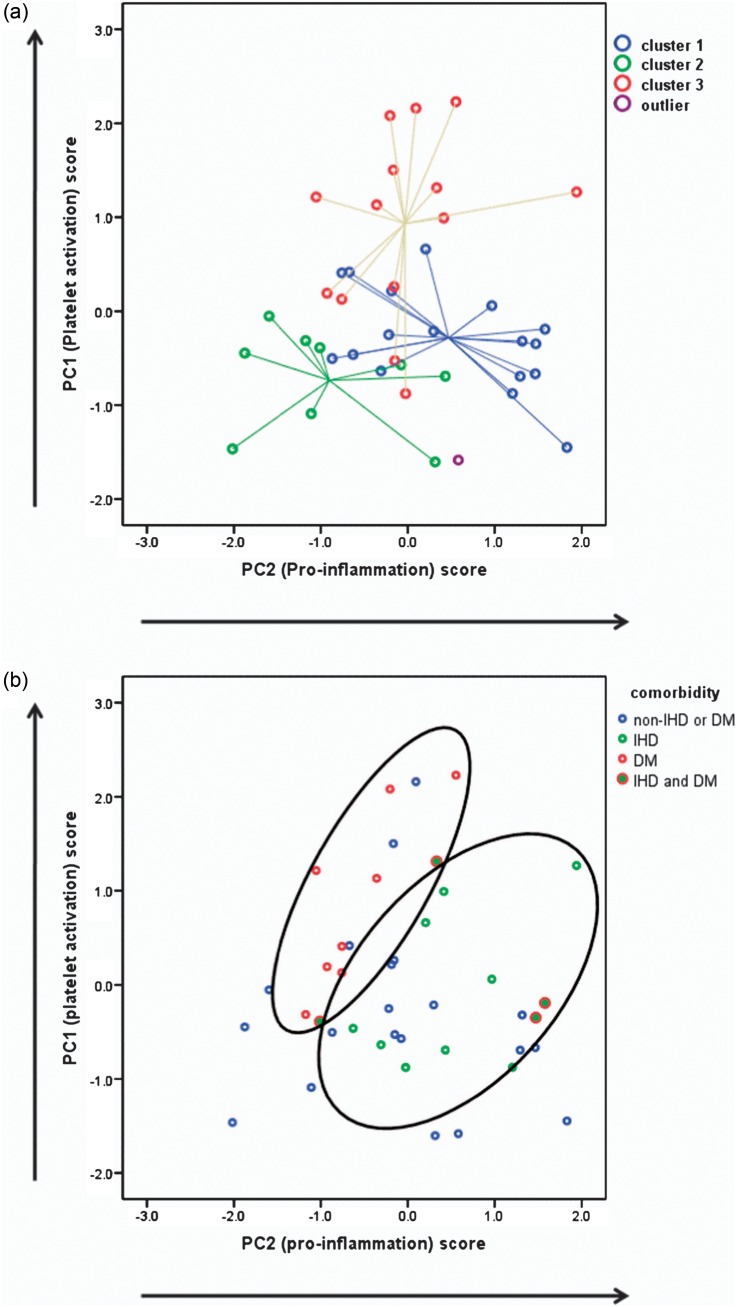
Fig. 4.
(a) Combined graphical representation of the HCA (centroid plot) and PCA (dimensionless weighted scores); there is good agreement between the methods showing association between Cluster 3 and increased platelet activation, Cluster 1 with inflammation and Cluster 2 with the absence of markers of endothelial dysfunction. (b) Combined graphical representation of PC scores and co-morbidity; IHD and DM are clustered according to their different pattern of PC scores.

