Fig. 1.
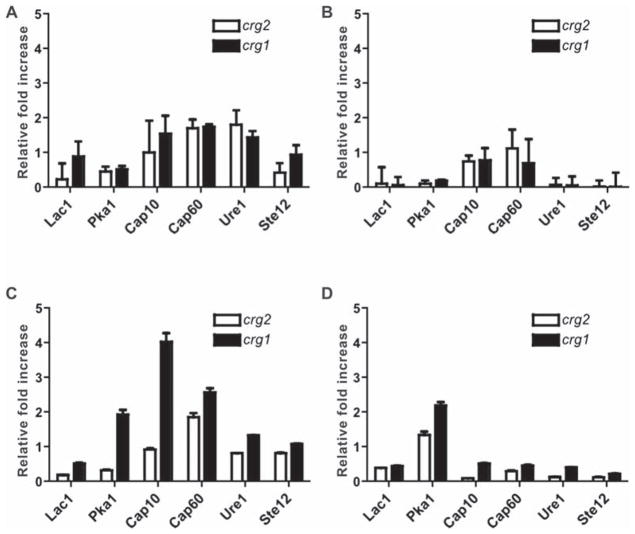
Gene expression in an in vitro macrophage interaction assay. Expression of several virulence-related genes was measured by reverse transcribed real time PCR after 2 h of interaction with J774A.1 cells (A) or medium alone (B), or after 8 h of interaction with J774A.1 cells (C) or medium alone (D). Gene expression is reported as a relative fold change of the expression of crg2Δ and crg1Δ mutant strains in comparison to wild type (WT) and is efficiency-corrected. Increase of 2 fold and over was considered significant [25]. Error bars represent standard error of the means, based on three replications (n = 3).

