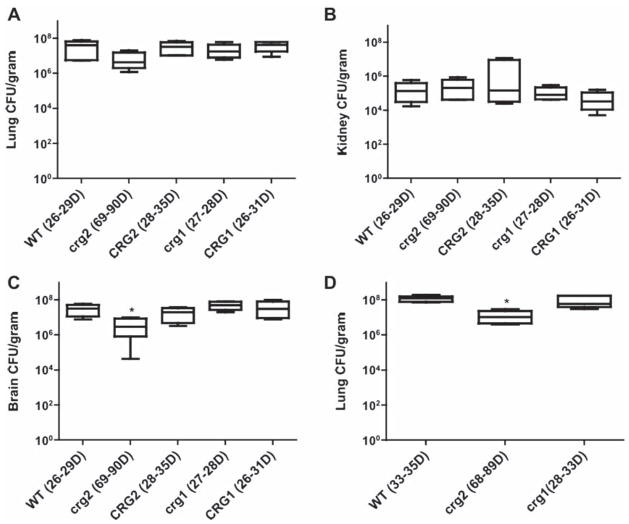
Fig. 3.
Assessment of fungal burdens during infection of murine models. Lung (A and D), kidney (B), and brain (C) of moribund animals infected with crg2Δ, crg1Δ, and WT were dissected and CFUs counted. Asterisks indicate that the differences are statistically significant (P < 0.05). All strains reach similar levels in the kidneys of moribund animals, but significantly fewer crg2Δ in the brains and the lungs of a repeat test (P < 0.05, one way ANOVA and Bonferroni post test). Bars represent standard error, A–C, n = 6; D, n = 5.

