
FIG 4 .
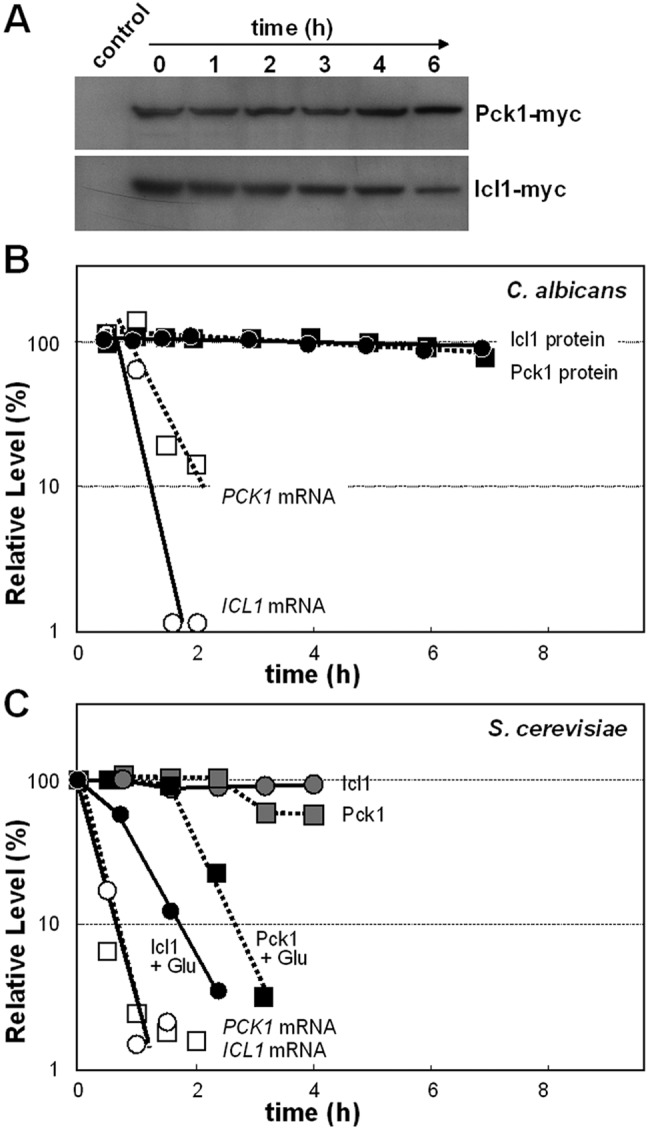
Icl1 and Pck1 protein stability and ICL1 and PCK1 mRNA turnover in C. albicans and S. cerevisiae following the addition of glucose. (A) CaIcl1-Myc and CaPck1-Myc protein levels were measured by Western blotting at various times after the addition of glucose to C. albicans cells grown on lactate. (B) CaIcl1-Myc and CaPck1-Myc were quantified by Western blotting relative to the Act1 internal control following glucose addition. Also CaICL1 and CaPCK1 mRNA levels were assayed in the same cultures by qRT-PCR and compared to the level in the ACT1 mRNA internal control after glucose addition. The relative levels of these mRNAs and proteins were expressed as a percentage of their abundance at time zero, which was set at 100%. (C) ScIcl1-Myc and ScPck1-HA protein levels were measured by Western blotting, and ScICL1 and ScPCK1 mRNA levels were assayed by qRT-PCR in S. cerevisiae cells grown on lactate and exposed to glucose at time zero. The relative levels of these mRNAs and proteins were expressed as a percentage of their abundance at time zero (which was set at 100%): circles, Icl1; squares, Pck1; black symbols, Icl1 and Pck1 proteins in lactate-grown cells after glucose addition; gray symbols, Icl1 and Pck1 proteins in control lactate-grown cells with no glucose addition; open symbols, ICL1 and PCK1 mRNAs in lactate-grown cells after glucose addition. Similar data were obtained from two independent replicate experiments.