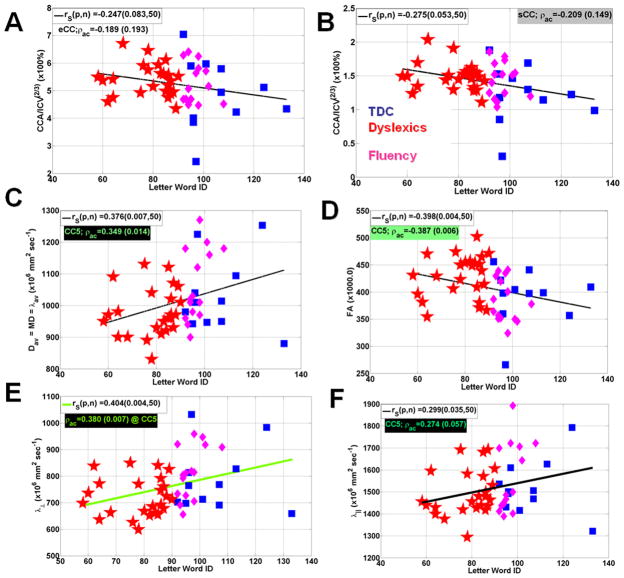
Figure 4.
Representative scatter plots and linear regression analysis for the three groups Letter Word ID scores vs. (A) Normalized entire CC midsagittal area (B) normalized splenium area (C) average mean diffusivity in CC5 (D) average FA in CC5 (E) average radial diffusivity in CC5 and (F) average radial diffusivity in CC5.

