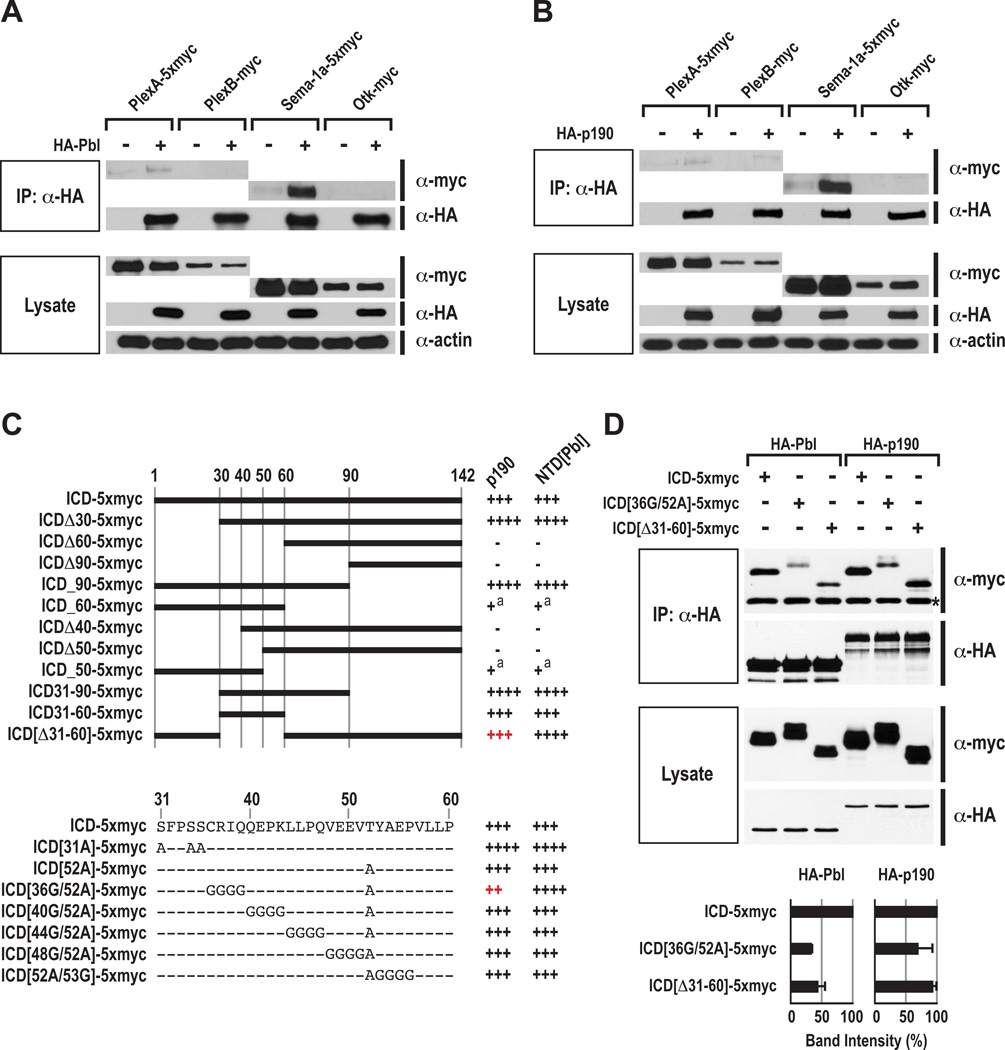
Figure 1. Pebble and RhoGAPp190 Physically Interact with Semaphorin-1a in S2R+ Cells.
(A) Interactions between Pbl and PlexA, PlexB, Sema-1a, and Otk in Drosophila S2R+ cells. Pbl and p190 were HA-tagged N-terminally, and PlexA, PlexB, Sema-1a and Otk were myc-tagged C-terminally. Pbl was cotransfected with or without PlexA, PlexB, Sema-1a, or Otk. Cell lysates were immunoprecipitated with anti-HA antibody and then blotted with anti-HA or anti-myc antibodies. Input lysates were also blotted with anti-myc, anti-HA, and anti-actin antibodies in the bottom.
(B) Interaction between p190 and PlexA, PlexB, Sema-1a, and Otk in Drosophila S2R+ cells. Co-IP experiments were performed as in Figure 1B.
(C) Schematic diagram of the Sema-1a ICD constructs used for protein interaction assays with p190 and with the N-terminal domain of Pbl (NTD[Pbl]) (right, a summary of their relative binding abilities). The intracellular domain is 142 amino acids long and numbered at the top. In the right column, the symbols “+” or “−” represent the presence or absence of protein interaction, respectively. The number of + symbols is correlated with relative binding levels. Superscript “a” indicates very weak interactions. At the bottom, amino acids and their mutated sequences within ICD residues 31–60 used for protein interaction assays with p190 and NTD[Pbl] are shown.
(D) Binding of wild-type and mutant Sema-1a ICD proteins to full-length Pbl and p190. Asterisk indicates non-specific IgG bands. Relative binding of Pbl and also p190 to Sema-1a ICD derivatives was measured by averaging band intensities from two experiments, as shown at the bottom. In each column, coimmunoprecipitated wild-type ICD-5xmyc was used as a control (equal to 100% in band intensity). Error bars indicate standard deviation.

