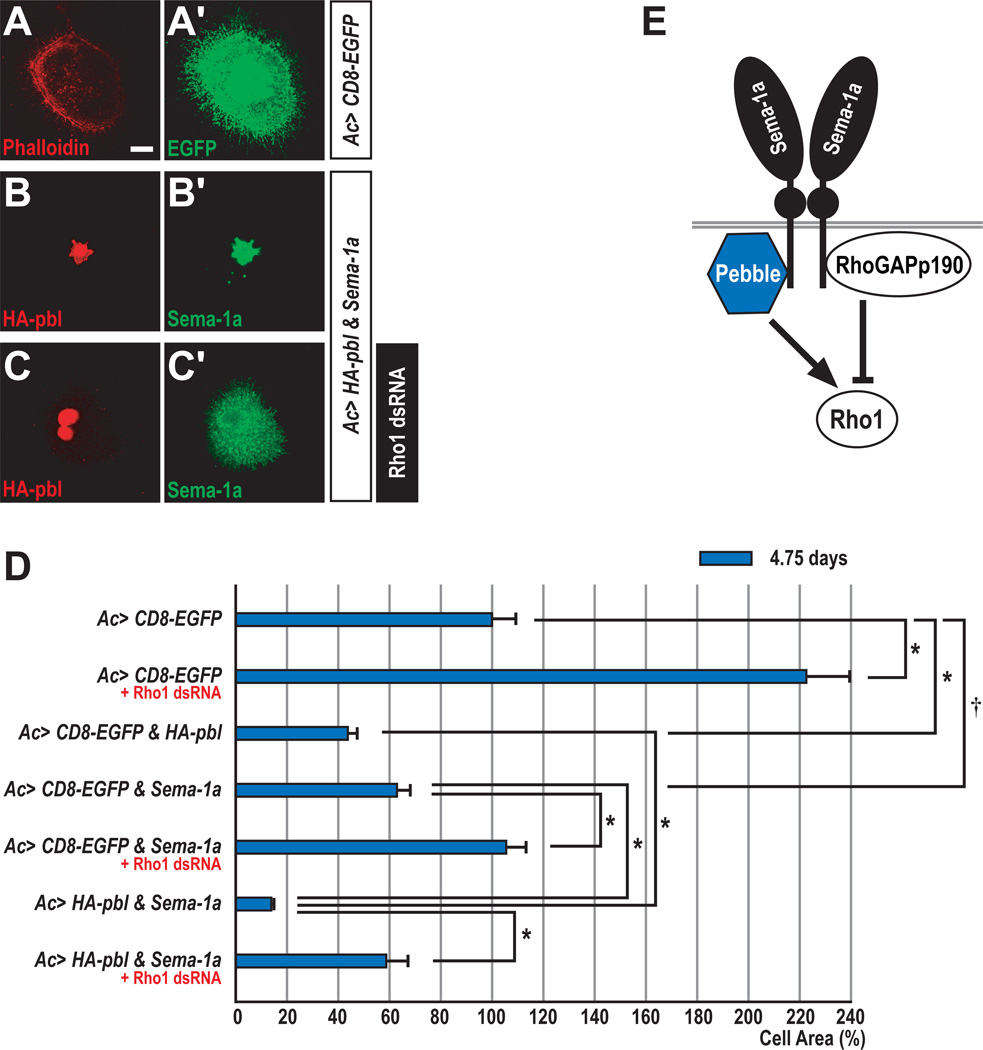
Figure 2. Collaboration between Pebble and Semaphorin-1a in Drosophila Cells.
(A–C) When cultured on concanavalin A-coated coverslips, most ML-DmBG2 cells become flattened. Overall cellular morphology was visualized with anti-GFP or anti-Sema-1a.
(A–A’) ML-DmBG2 cells transfected with membrane-tethered EGFP (CD8-EGFP) were stained with rhodamine-phalloidin (red) and anti-GFP (green).
(B–B’) ML-DmBG2 cells cotransfected with HA-pbl and Sema-1a were stained with anti-HA (red) and anti-Sema-1a (green). Ectopically expressed HA-Pbl protein was predominantly localized to the nucleus.
(C–C’) ML-DmBG2 cells cotransfected with HA-pbl and Sema-1a were treated with Rho1 dsRNA for 4.75 days and then stained with anti-HA (red) and anti-Sema-1a (green). Cells with multiple nuclei were frequently observed following Rho1 dsRNA treatment.
(D) Quantification of Sema-1a, pbl and Rho1 effects on cell size. CD8-EGFP-expressing cells were used as a control (100% cell area). Error bars indicate S.E.M. by t-test (*p<0.0001 and †p=0.001).
(E) Proposed interactions between Pbl and p190 with Sema-1a, highlighting potential antagonistic regulation of the small GTPase Rho1.
Scale bar, 10 µm (A–C).

