
Figure 3.
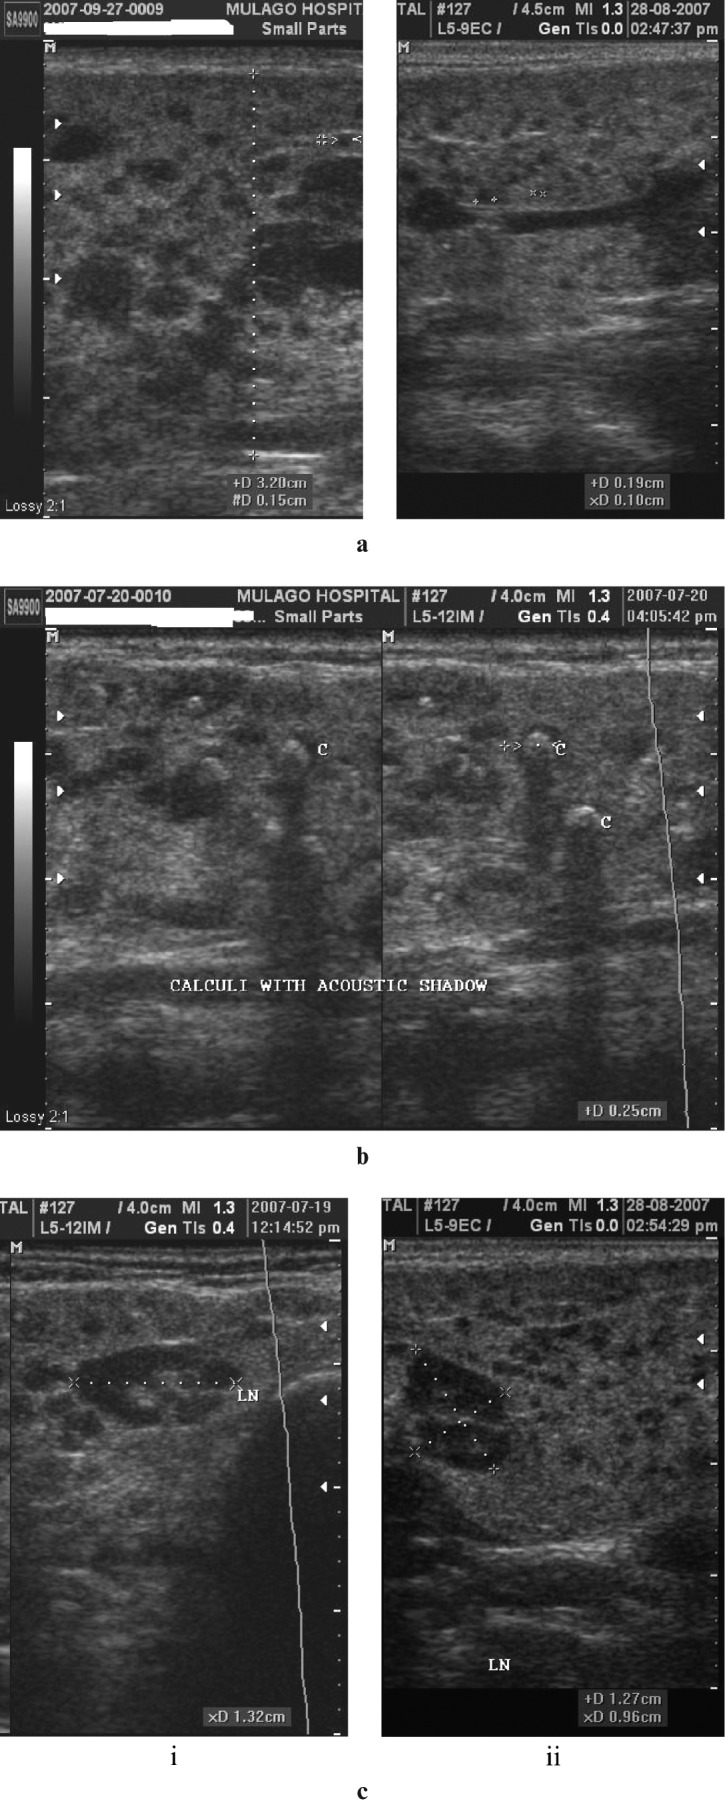
(a) Lymphocytic aggregations. Coronal scans of the parotids demonstrating a heterogeneous appearance, with diffuse, mainly small, hypoechoic or anechoic areas interspersed within apparently normal echogenic gland substance. (b) Lymphocytic aggregations with internal echogenic foci (two images juxtaposed). The coronal scans of the right parotid gland appear heterogeneous. Within hypoechoic areas are numerous echogenic foci resembling microcalcifications (short hyperechoic lines with dark posterior acoustic shadows). (c) Lymphocytic aggregations with lymphadenopathy. Axial (i) and coronal (ii) scans of the right parotid gland, demonstrating asymmetrical distribution of multiple hypoechoic areas, together with intraparotid lymph nodes (LN). Electronic cursors show the size of one of the nodes in three dimensions, approximately 13 × 13 × 10 mm