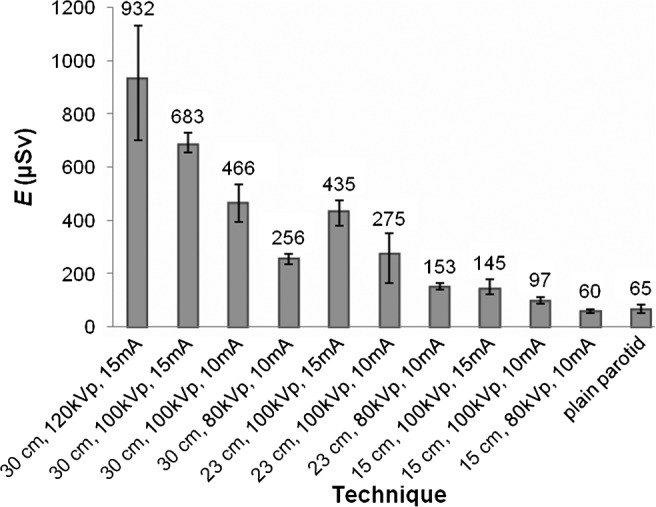
Figure 1.

Variation of effective dose, E, with different fields of view (FOV) size, milliamperage (mA) and peak kilovoltage (kVp) settings. This graph compares E for the different cone beam CT techniques that were centred on the left parotid gland with the E calculated for the collective plain radiographs made during a sialography procedure of the same gland. The plain radiographs included one panoramic radiograph, two anterior–posterior skull radiographs and four lateral skull radiographs
