
Figure 6.
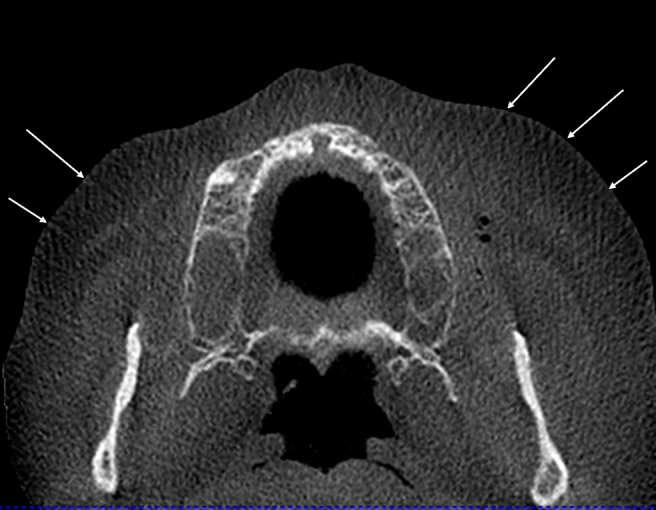
Typical aliasing patterns (Moire patterns) in cone beam CT (CBCT) data sets. The lines (arrows) diverge from the centre towards the periphery and are most probably caused by the undersampling owing to the cone beam geometry illustrated in Figure 5