
Figure 7.
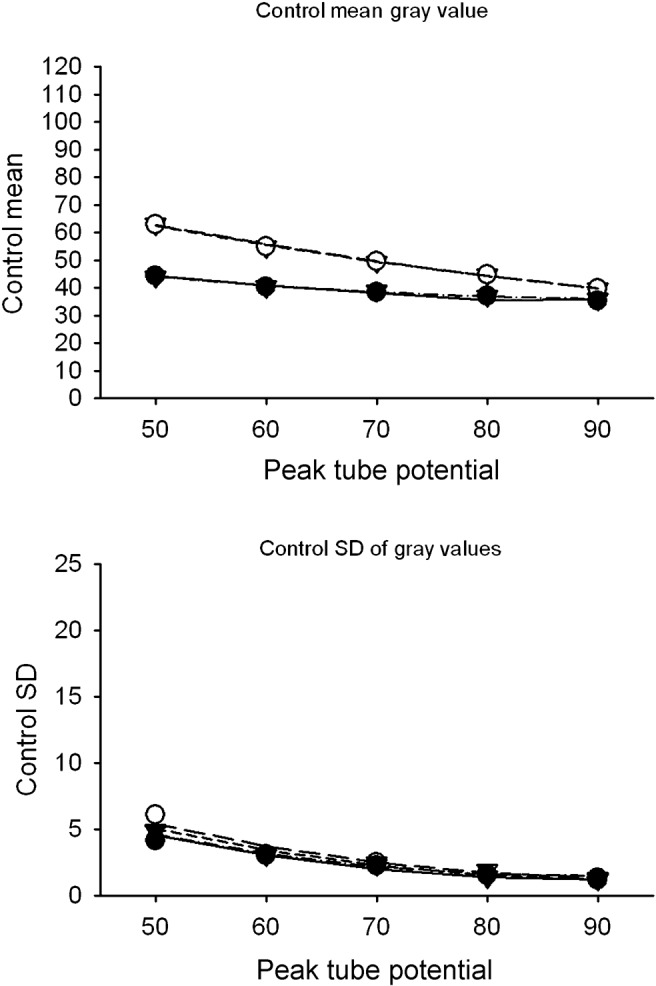
Observed and predicted control mean gray value (upper panel) and control SD of gray values (lower panel) by metal artefact reduction (with or without), presence of metal (with or without) and peak tube potential. SD, standard deviation
Official websites use .gov
A
.gov website belongs to an official
government organization in the United States.
Secure .gov websites use HTTPS
A lock (
) or https:// means you've safely
connected to the .gov website. Share sensitive
information only on official, secure websites.
Observed and predicted control mean gray value (upper panel) and control SD of gray values (lower panel) by metal artefact reduction (with or without), presence of metal (with or without) and peak tube potential. SD, standard deviation