
Figure 1.
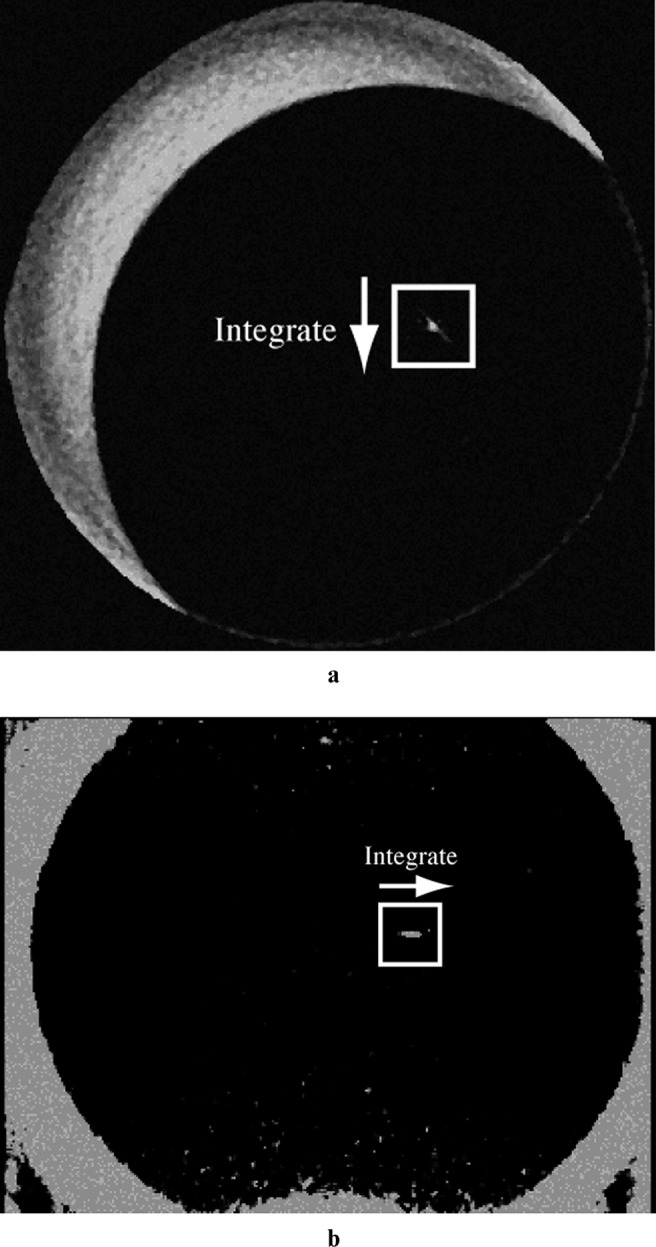
Reconstructed images of the 100 μm tungsten wire. (a and b) Images in the axial and z-axis directions, respectively. The white squares surrounding the wire represent the region of interest, the size of which is 30×30 pixels. For the modulation transfer function determination, the line-spread function was obtained by integrating in the direction illustrated by the arrows