Figure 5.
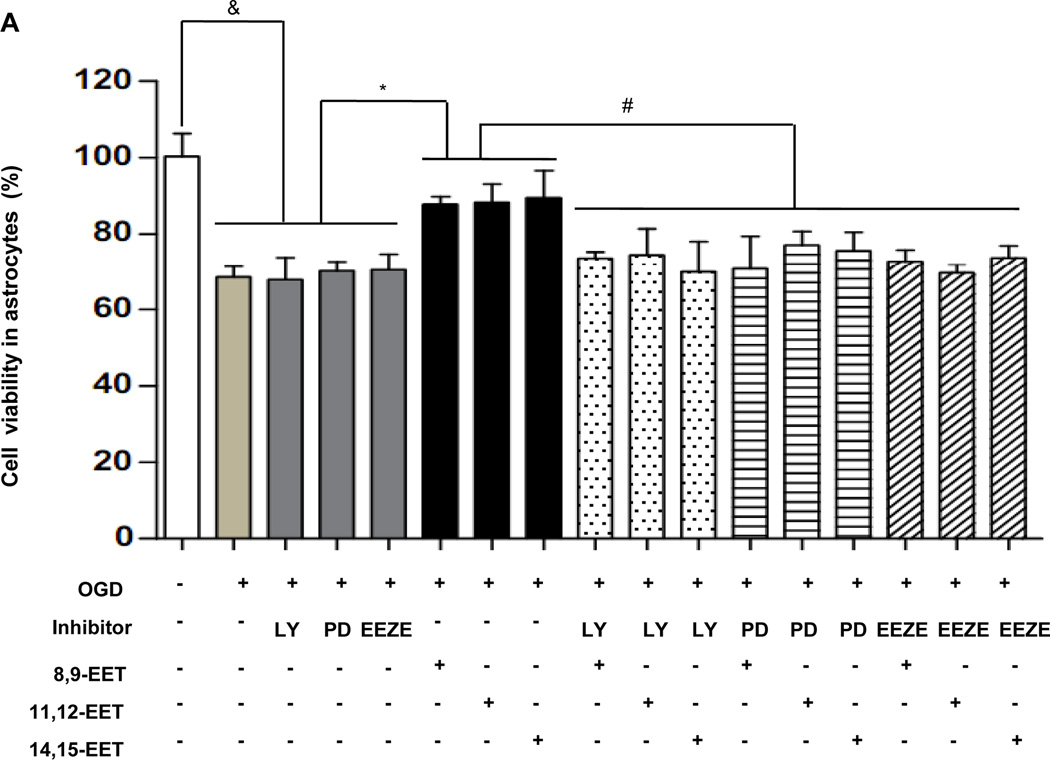
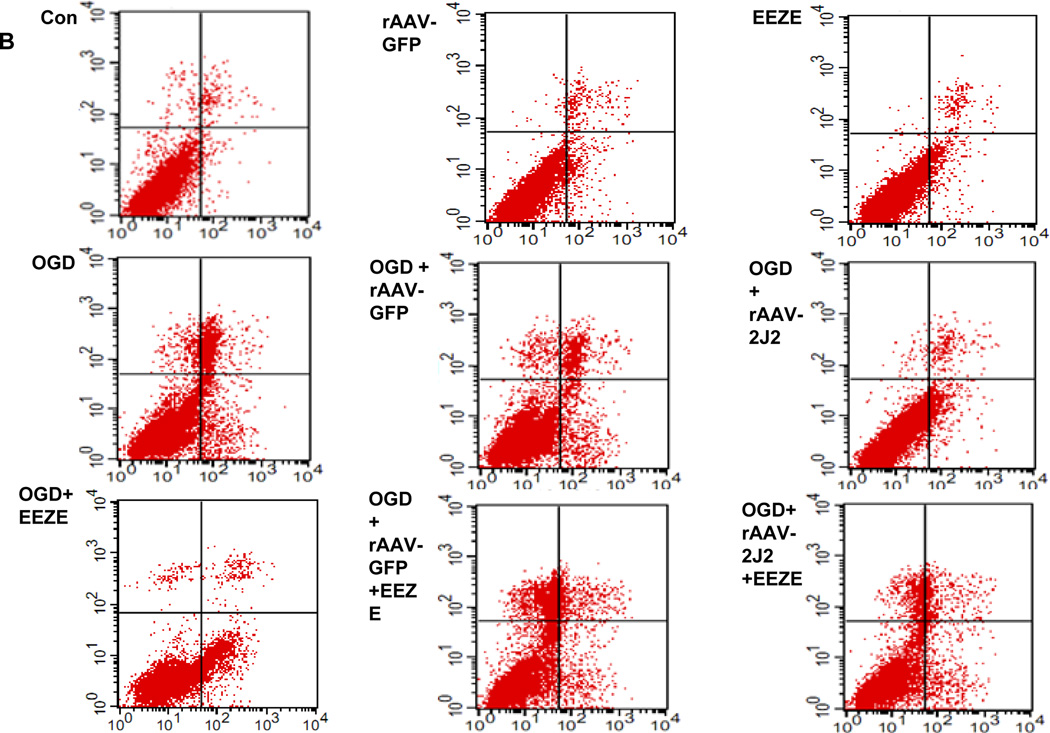
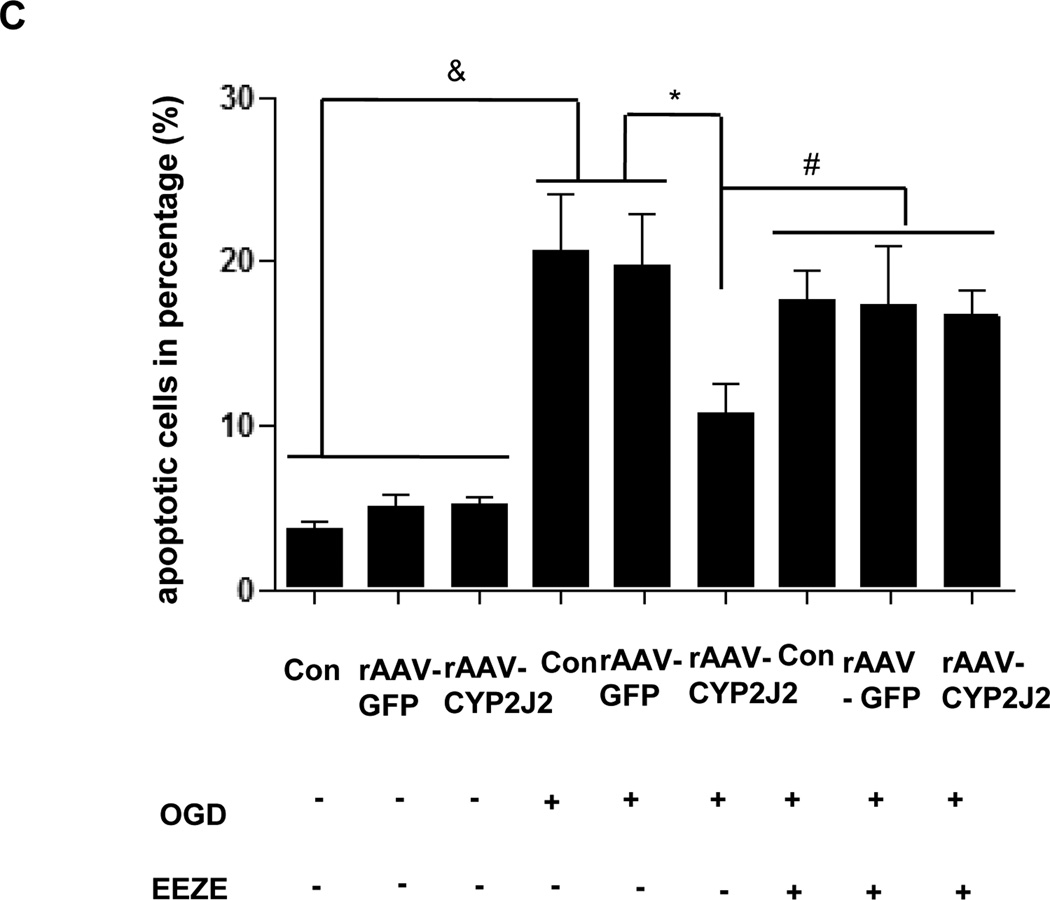
The protective effect of EETs in astrocytes and Neuro-2a exposed to OGD. (A) The viability of primary astrocyte determined by Trypan blue staining with PI3K inhibitor LY294002, MAPK inhibitor PD98059 and EETs inhibitor EEZE. Treatment with EETs reversed the reduction of vital cells induced by OGD, However, pretreatment cells with PI3K inhibitor LY294002, MAPK inhibitor PD98059 and EETs inhibitor EEZE attenuated this protective effect of EETs. Bar graph: mean ± SEM, n =3. *p < 0.05 versus OGD, #p < 0.05 versus EETs combined with inhibitors, &p < 0.05 versus control cells. (B) Representative results of flow cytometry plots by annexin-V-FITC/propidium iodide (PI) staining to show the apoptosis of Neuro-2a exposed to OGD. Cells with negative staining of both PI and annexin V are living; PI-negative and annexin V-positive staining are early apoptotic cells; PI-positive and annexin V-positive staining are cells in a late stage of apoptosis. (C) Average percentage of apoptotic cells from three independent flow cytometry experiments and the values shown are mean ± SEM ; &p < 0.05 vs. normoxia; *p<0.05 vs. OGD; #p<0.05 vs. OGD + rAAV- 2J2.


