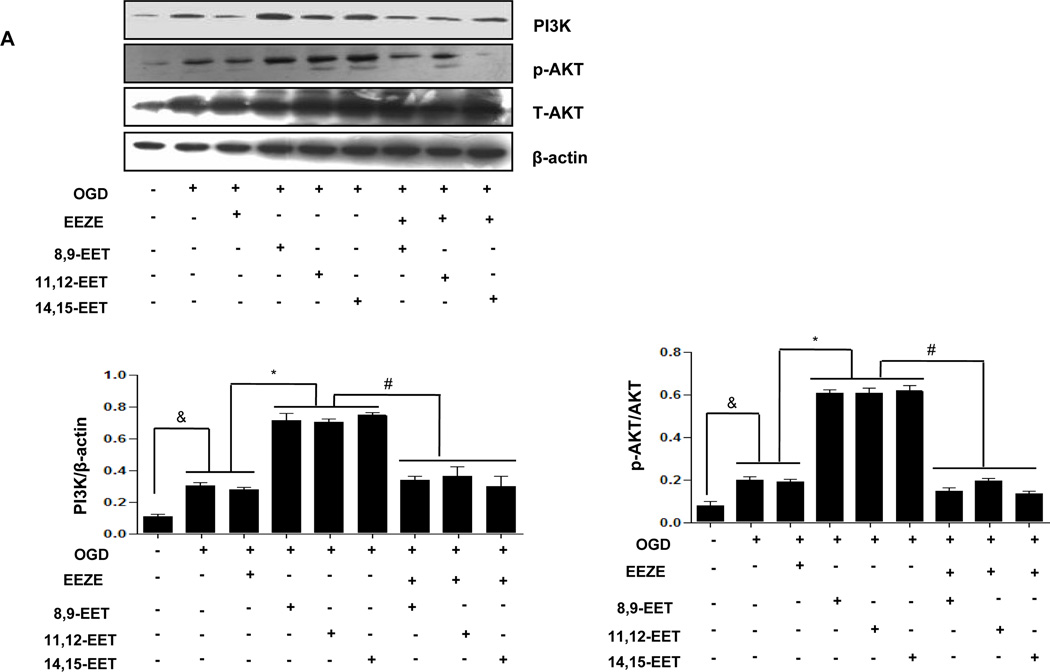
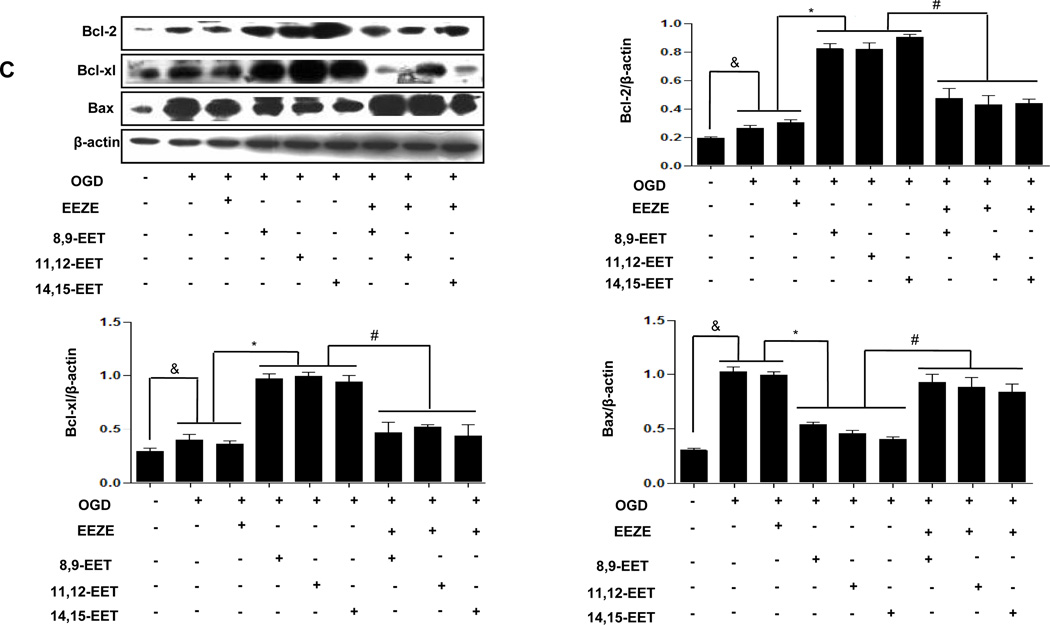
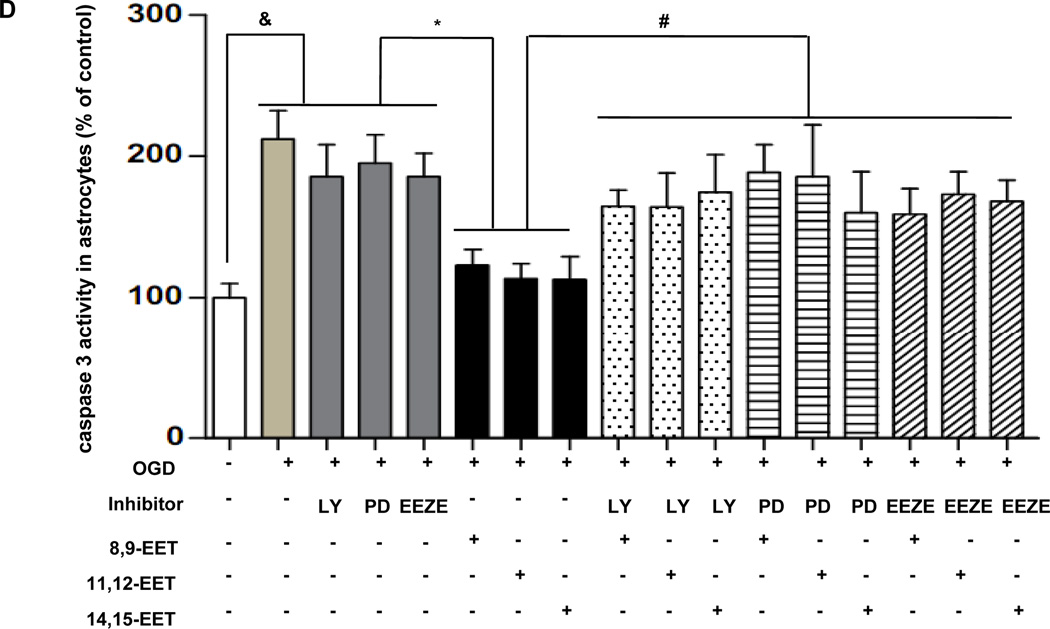
Figure 6.
Representative Western blots showing protective effects of EETs and CYP2J2 overexpression in astrocytes. (A–C) Cell lysates were analyzed by immunoblotting using antibodies against PI3K, p-AKT (A), p-Erk1/2 (B) and antibody recognizing Bcl-2, Bcl-xl and Bax (C) and densitometric analysis of band intensity of these signaling molecules to their internal controls were calculated respectively. The data from three independent experiments are given as mean ± SEM; &p < 0.05 vs. normoxia; *p<0.05 vs. OGD; #p<0.05 vs. OGD + EETs. (D) Effect of EETs on caspase-3 activity in cultured cortical astrocytes exposed to OGD and inhibitors. The results are shown as percentages of the control value in the normoxia conditions. Each value is mean ± SEM from five independent experiments; &p < 0.05 vs. normoxia; *p < 0:05 vs. OGD; #p < 0.05 vs. OGD + EETs.


