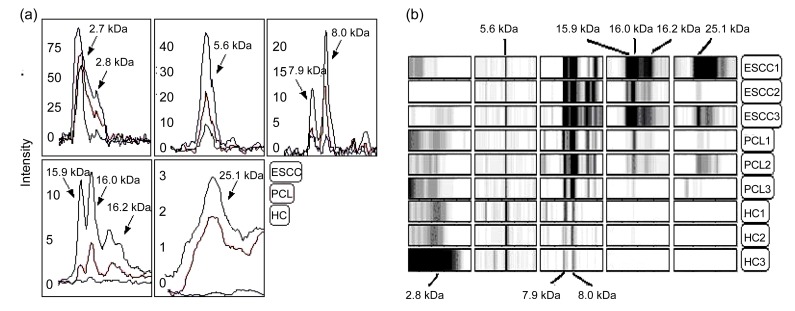
Fig. 3.
Differential expressions of serum markers
(a) Representative spectral overlays of the serum markers from ESCC (black line), PCL (red line), and HC (blue line) individuals. The overlays show that expressions of the markers 7.9, 8.0, 15.9, 16.0, 16.2, and 25.1 kDa gradually increase from the HC, PC to ESCC group, whereas concurrently the expressions of the markers 2.7, 2.8, and 5.6 kDa decrease in the ESCC group. Numbers in the mass spectra represent the observed mass of the marker in the particular sample; (b) Detection of differentially expressed ovarian cancer associated serum proteins. A representative gel view of ESCC was associated serum markers. Gels from three representative ESCC serum samples are shown at the top, three representative PCL samples in the middle, and three HC spectral profiles at the bottom (Note: for interpretation of the references to color in this figure legend, the reader is referred to the web version of this article)

