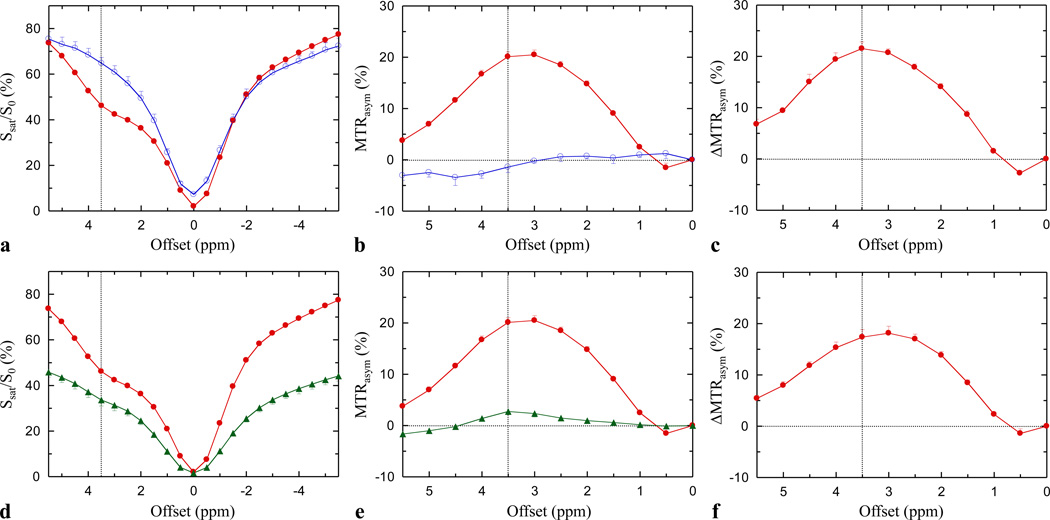
Fig. 1.
(a–c) MT, MTRasym, and ΔMTRasym spectra measured for the fresh egg white (red line) and egg yolk (blue line, n = 4). The large dip at the frequency offset of 3.5 ppm (corresponding to the amide resonance frequency) in the fresh egg white MT spectrum (a) clearly indicates the existence of the APT effect, which gives rise to a large positive MT difference in the resulting asymmetry curve (b). In contrast, the effect of APT is negligible in the fresh egg yolk. The MTRasym change between the fresh egg white and yolk (c) is maximized at offset 3.5 ppm. (d–f) MT, MTRasym, and ΔMTRasym spectra measured for the fresh (red line) and cooked egg white (green line, n = 4). The effect of MTC is increased in the cooked egg white (d), but the effect of APT is largely reduced (e), because all proteins were denatured and became opaque.

