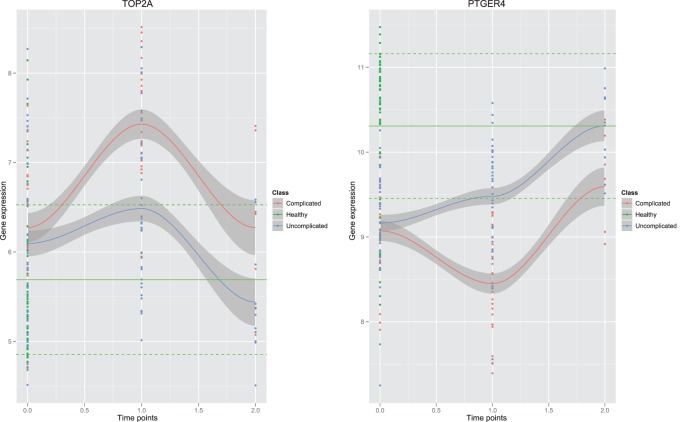
Fig. 3.
TOP2A (left panel) and PTGER4 (right panel) gene expression trends on the test data. X-axis indicates time points. Y -axis is the gene expression. Green: control, red: complicated burn patients, blue: uncomplicated burn patients. The solid green line indicates the mean gene expression of healthy people the dotted green line indicates the mean ± standard deviation.

