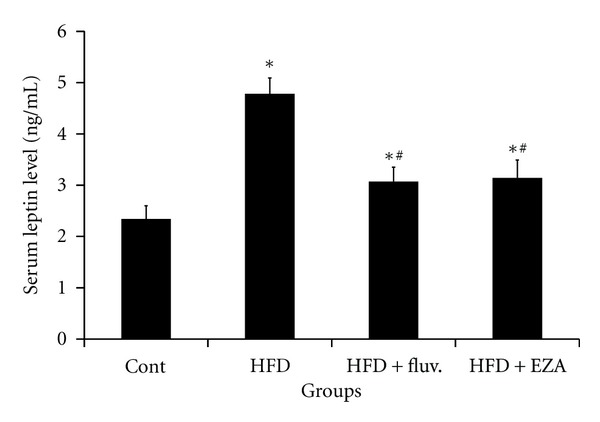
Figure 2.

Effect of EZA on leptin level of experimental rats. Values are given as mean ± SD for group of 8 animals each. Values are statistically presented as follows: *P < 0.05 significant differences compared to controls. # P < 0.05 significant differences compared to HFD rats.
