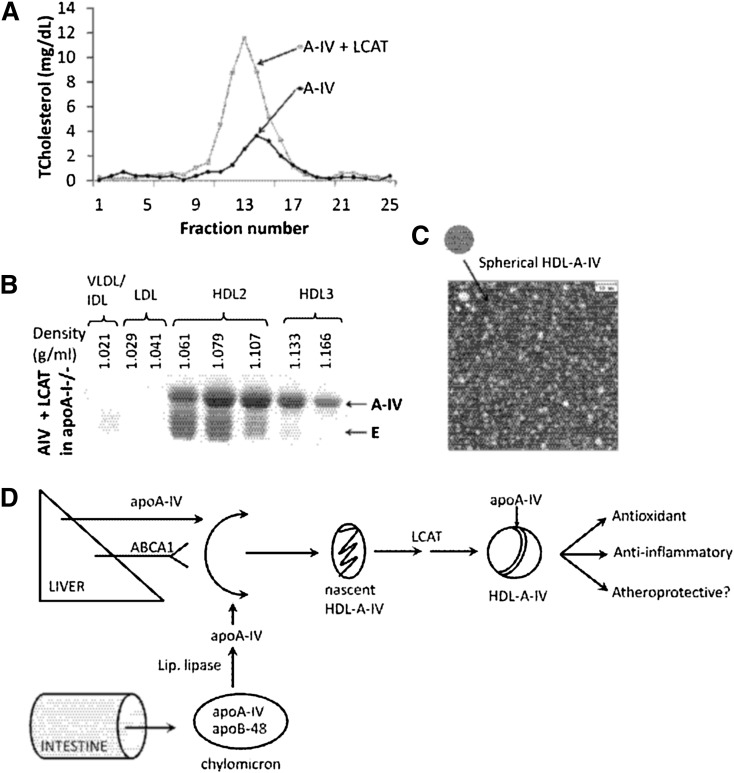
Fig. 5.
Analysis of plasma from apoA-I−/− mice coinfected with 109 pfu adenovirus expressing human apoA-IV and 5 × 10⁸ pfu adenovirus expressing human LCAT. A: FPLC profiles. B: SDS-PAGE of the fractions isolated by density gradient gel electrophoresis. C: EM analysis of the HDL2 fractions shown in B. D: Schematic representation of the pathway of biogenesis and the putative beneficial functions of HDL-A-IV.

