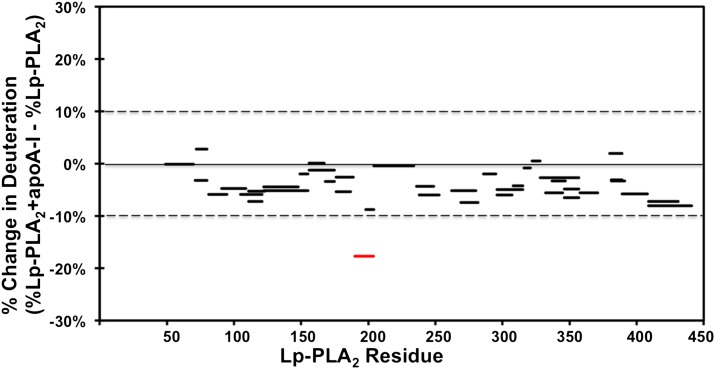
Fig. 3.
Deuterium exchange information on Lp-PLA2 in the presence of human apoA-I. The difference in percentage between deuterium incorporation for individual peptides of Lp-PLA2 in the presence (red) or absence of apoA-I (blue) at 100 s is shown. Peptides are shown as bars spanning over the indicated sequence on the x axis. All changes greater than 10% are shown in red.

