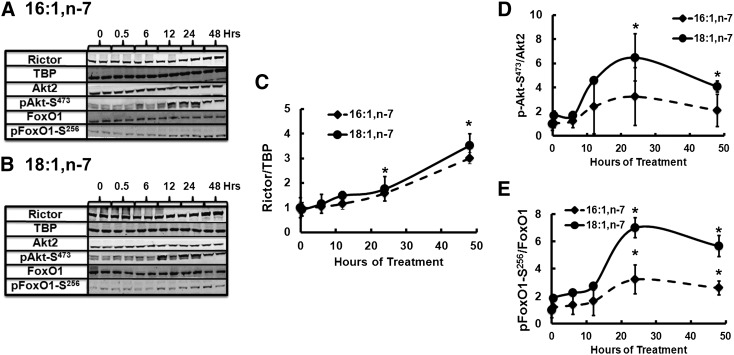
Fig. 11.
Time course of 16:1,n-7 and 18:1,n-7 effects on rictor protein abundance and Akt-S473 and FoxO1-S256 phosphorylation in HepG2 cells. HepG2 cells were treated with 16:1,n-7 or 18:1,n-7 at 50 μM for the times indicated in the figure, and cells were harvested for protein extraction and immunoblotting. Levels of rictor, TBP (loading control), Akt2, phospho-Akt1/2/3-S473, FoxO1, and phospho-FoxO1-S256 were measured as described above. A, B: Representative immunoblots for 16,n-7 and 18:1,n-7 treated cells, respectively, two extracts per treatment. C–E: Rictor protein abundance, phosphorylation status of Akt2-S473, and FoxO1-S256. Results are representative of three separate studies and are expressed as mean ± SD, n = 3. * P ≤ 0.05 versus no FA treatment (zero-time).

