Fig. 8.
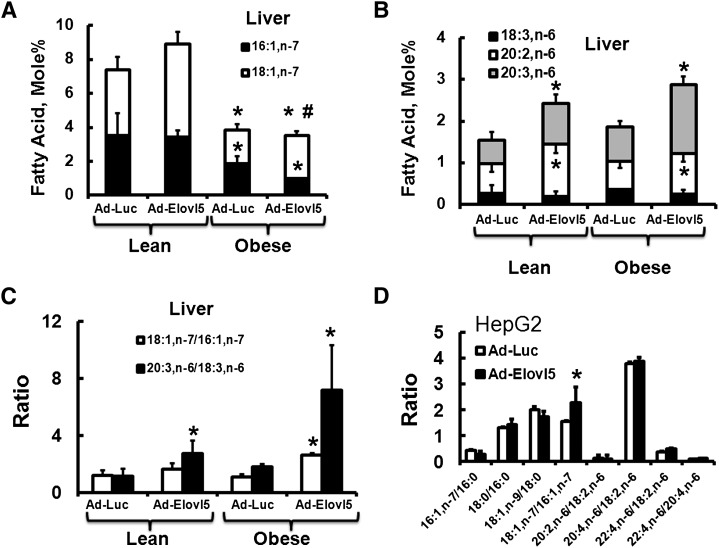
Elovl5 regulates FA composition in livers of obese glucose-intolerant mice and HepG2 cells. Lipids were extracted and FA analysis was performed on livers of lean and obese mice (Materials and Methods) and HepG2 cells. A: n-7 MUFAs from livers of lean and obese mice infected with either Ad-Luc or Ad-Elovl5 are expressed as FA mol%. B: n-6 PUFAs from livers of lean and obese mice infected with either Ad-Luc or Ad-Elovl5 are expressed as FA mol%. C: The mole ratio of 18:1,n-7/16:1,n-7 and 20:3,n6/18:3,n6 in livers of lean and obese mice infected with either Ad-Luc or Ad-Elovl5. D: Ratio of FA pairs in HepG2 cells infected with Ad-Luc or Ad-Elovl5. Results are expressed as mean ± SD, n = 3. * P ≤ 0.05 versus Ad-Luc.

