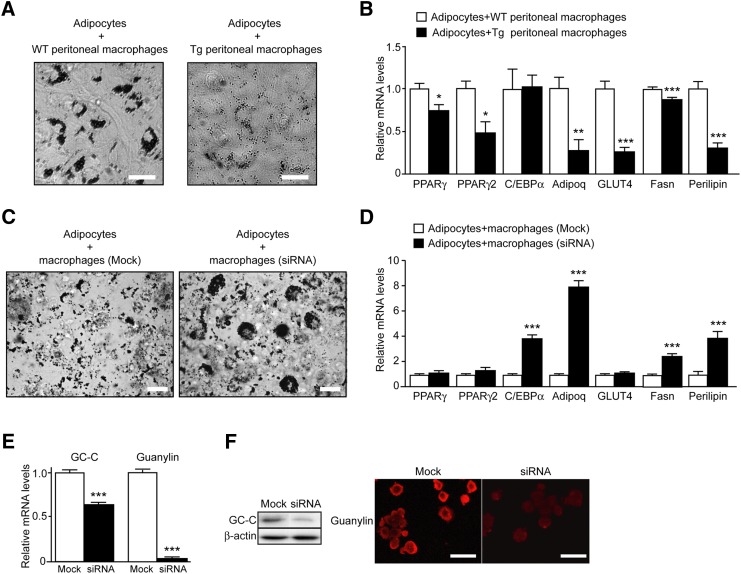
Fig. 6.
Coculture of primary adipocytes with guanylin- and GC-C-expressing macrophages. (A) Lipid accumulation in adipocytes cocultured with peritoneal macrophages of WT and Tg rats. Neutral lipids were stained with Oil Red O on day 8 after the induction of adipogenesis. Scale bar, 20 μm. (B) Quantitative PCR of genes involved in adipocyte maturation and droplet formation. Data were normalized against the mRNA levels of ribosomal protein 36B4 and are expressed as fold induction relative to that of adipocytes with peritoneal macrophage of WT rats. Data are presented as means ± SEM (n = 16). *P < 0.05, **P < 0.01, ***P < 0.001 compared with the value for adipocytes cocultured with peritoneal macrophages of WT rats. (C) Lipid accumulation in adipocytes cocultured with nontargeting control mock-transfected macrophages or cocultured with macrophages transfected with guanylin and GC-C siRNAs. Neutral lipids were stained with Oil Red O six days after the induction of adipogenesis. Scale bar, 20 μm. (D) Quantitative PCR of genes involved in adipocyte maturation and droplet formation. Data were normalized against the amount of 36B4 mRNA and were expressed as fold induction relative to that of adipocytes cocultured with mock-transfected macrophages. Data are presented as means ± SEM (n = 5). ***P < 0.001 compared with the value for adipocytes cocultured with mock-transfected macrophages. (E) mRNA levels of GC-C and guanylin in macrophages 24 h after their transfection with specific siRNAs against GC-C or guanylin or mock siRNA. ***P < 0.001 compared with value for mock-transfected macrophages (n = 7). (F) Western blot analysis of GC-C and immnunohistochemical analysis of guanylin in macrophages 6 days after transfection with GC-C, guanylin, or mock siRNA. β-actin was used as a loading control. For immunohistochemical analysis, cultured cells were fixed with paraformaldehyde and stained with anti-guanylin antibody and Alexa-594-conjugated anti-rabbit IgG. Scale bar, 50 μm.

