Fig. 4.
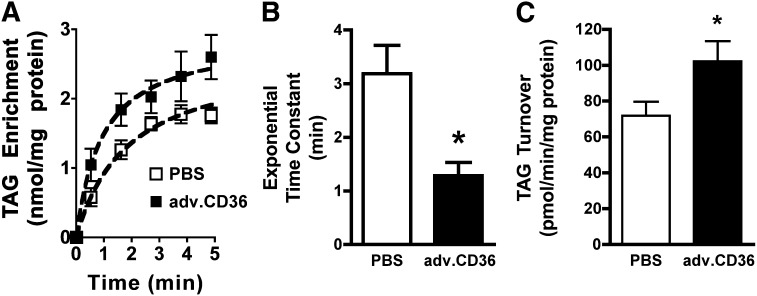
TAG dynamics. (A) Initial exponential phase of TAG enrichment showing the mean data as well as an exponential fit of the saturable component of TAG enrichment. (B) Time constant (τ) of exponential enrichment phase of TAG. (C) Rate of TAG turnover. For all panels, means ± SE, n = 5 for sham and adv.CD36, *P < 0.05.

