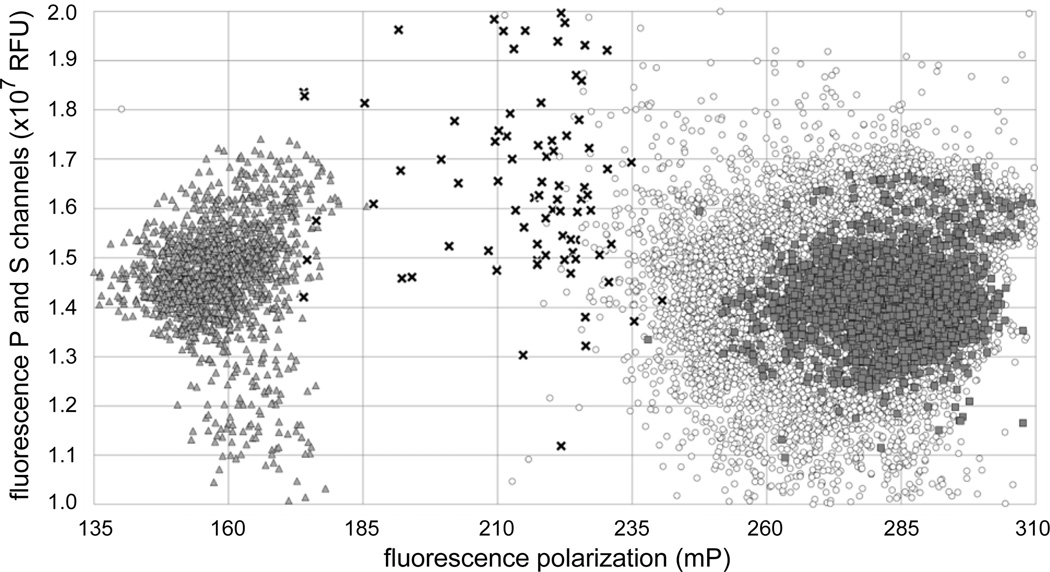
Figure 2. Scatter plot of HTS results.
The X-axis represents the fluorescence polarization in mP units for each well. The Y-axis represents the sum of the parallel and perpendicular fluorescence channels in relative fluorescence units. The limits of the Y-axis correspond to the values used to filter in experimental values during hit analysis (between 1–2 × 10⁷ RFU). Positive (RNA alone) and negative (RNA and protein, no compound or extract) controls are indicated by dark triangles and dark squares, respectively. The values for the 79 hits and 26345 non-hits compounds wells are indicated by black crosses and open circles, respectively.

