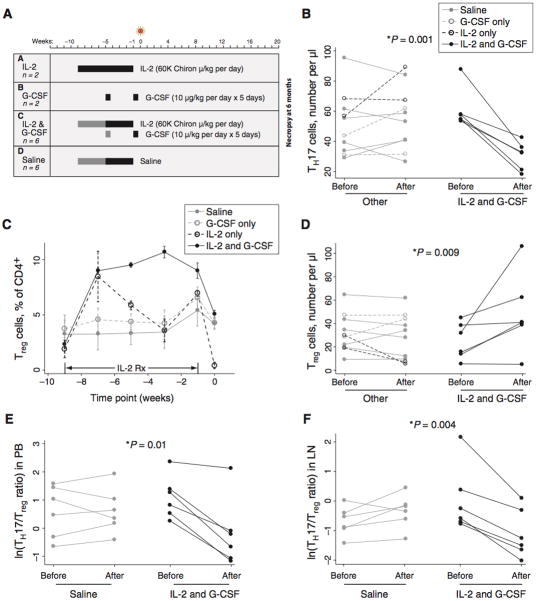
Fig. 3.
Treatment with IL-2 and G-CSF causes expansion of Tregs, depletion of Th17 cells, and reduction in the Th17:Treg ratio. (A) Rhesus macaques were treated with IL-2 alone, G-CSF alone, both agents together, or saline only. In Groups C and D, two animals were given two cycles of treatment (black and gray bars) and four animals were given one cycle (black bars only). All drugs were withdrawn before infection with SIV. (B) IL-2 and G-CSF treatment causes depletion of Th17 cells. The patterns shown in the legend to this panel are also used in panels C–F. The label “Post” indicates the day of infection; i.e., time 0 in Figure 3A. Note that data for two of the six IL-2 and G-CSF-treated animals in this panel overlap closely. The p value shown (0.001) is for a Mann-Whitney U test of change in Th17 cell number after IL-2 and G-CSF treatment (difference of “Post” and “Pre” values) versus change after other treatment; a Kruskal-Wallis test of differences in groups A–D was also significant (p=0.01). Data in panels B–D are from PBMC. (C) Substantial expansion of phenotypic Tregs in macaques treated with IL-2 alone (black dashed line) or IL-2 and G-CSF (black solid line). Tregs plotted in this panel were identified as CD3+CD4+CD25+CD127low. Lines represent mean values observed in animals treated for nine weeks. Data are mean +/− SE. (D) Expansion of Tregs in animals treated with IL-2 and G-CSF. This panel shows the overall change in Treg number between the start and end of treatment. The p value shown (0.009) is for a Mann-Whitney U test of change in Treg cell number after IL-2 and G-CSF treatment versus change after other treatment; a Kruskal-Wallis test of differences in groups A–D was also significant (p=0.02). (E) Reduction of the Th17:Treg ratio in treated animals. The p value indicates that the reduction in the Th17:Treg ratio occurring with treatment is significantly greater in the IL-2- and G-CSF-treated group (Mann-Whitney U test of change occurring in treated animals of Group C compared to saline-treated animals in Group D). (F) Reduction of the Th17:Treg ratio in lymph node tissue after IL-2 and G-CSF treatment. Mann-Whitney (IL-2 and G-CSF vs. other treatment) and Kruskal-Wallis (groups A–D) tests both yielded significant p values (p=0.02 in both cases).

