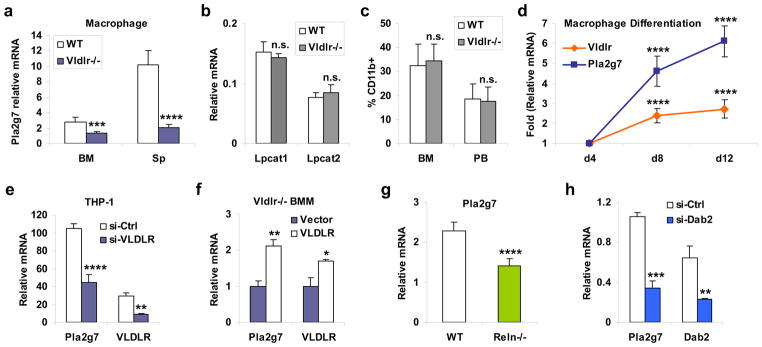
Figure 4. Macrophage VLDLR signaling promotes Pla2g7 expression.
a, Pla2g7 mRNA expression was reduced in Vldlr−/− macrophages compared to WT macrophages (n=4). BM, bone marrow; Sp, spleen. b, The mRNA expression of PAF synthases, Lpcat1 and Lpcat2, was unaltered in the Vldlr−/− BM macrophages (BM, n=4). For a–b, 1×10⁶ macrophages were differentiated from 1.5×10⁶ bone marrow cells or 5×10⁶ splenocytes of Vldlr−/− mice or WT control mice (male, 3 month old). c, FACS analysis of macrophages (CD11b+) in the bone marrow (BM) and peripheral blood (PB) of Vldlr−/− mice and WT control mice (n=3, male, 3 month old). d, Pla2g7 and Vldlr mRNA levels during a differentiation time course of WT bone marrow macrophages (n=4, male, 3 month old). The p values compare the expression on day 8 (d8) or day 12 (d12) with the expression on day 4 (d4). e, VLDLR knock-down decreases Pla2g7 mRNA expression in human macrophages (n=3). The human monocyte cell line THP-1 was transfected with hVLDLR siRNA (si-VLDLR) or control siRNA (si-Ctrl) for 24 hrs, and then differentiated into macrophage with TPA (40 ng/ml) for 48hrs. f, Exogenous VLDLR expression rescues Pla2g7 mRNA expression in Vldlr−/− macrophages (n=3). Bone marrow cells from Vldlr−/− mice (male, 3 month old) were transfected with VLDLR or vector control for 24 h, and differentiated into macrophage with MCSF for 6 days. g, Pla2g7 mRNA expression was reduced in Reln−/− macrophages (n=4). Macrophages were differentiated from the bone marrow of 20-day-old Reln−/− (reeler) or WT littermate control mice before the lethality of reeler mice at ~6 week. h, Pla2g7 mRNA expression was reduced in Dab2-deficient macrophages (n=3). WT bone marrow cells were transfected with Dab2 siRNA (si-Dab2) or control siRNA (si-Ctrl) for 24 hrs, and then differentiated into macrophages. Statistical analyses were performed with Student’s t-Test and all data are shown as mean ± standard deviation; *, p<0.05; **, p<0.01; ***, p<0.005; ****, p<0.001; n.s., non-significant.

