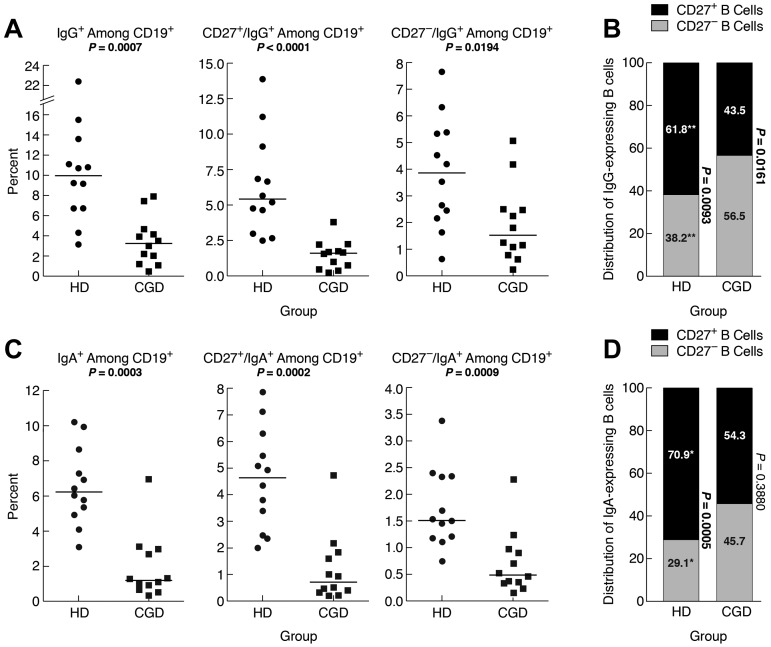
Figure 2.
Reduced IgG and IgA memory B cells in blood of CGD patients. PBMCs of samples used in the functional analyses in Figure 3 were stained for expression of (A) IgG or (C) IgA among CD19+ (left panel), CD27+ (middle panel), and CD27− (right panel) B cells. (B) IgG- and (D) IgA-expressing B cells among PBMCs in panels A and C were divided into CD27+ and CD27− compartments and shown as means for each group. The P values were determined and shown as follows for stacked data. *P < .05. **P < .001. ***P < .0001. (B,D) The numerical P values refer to the comparison between CD27− and CD27+ B cells within each group.

