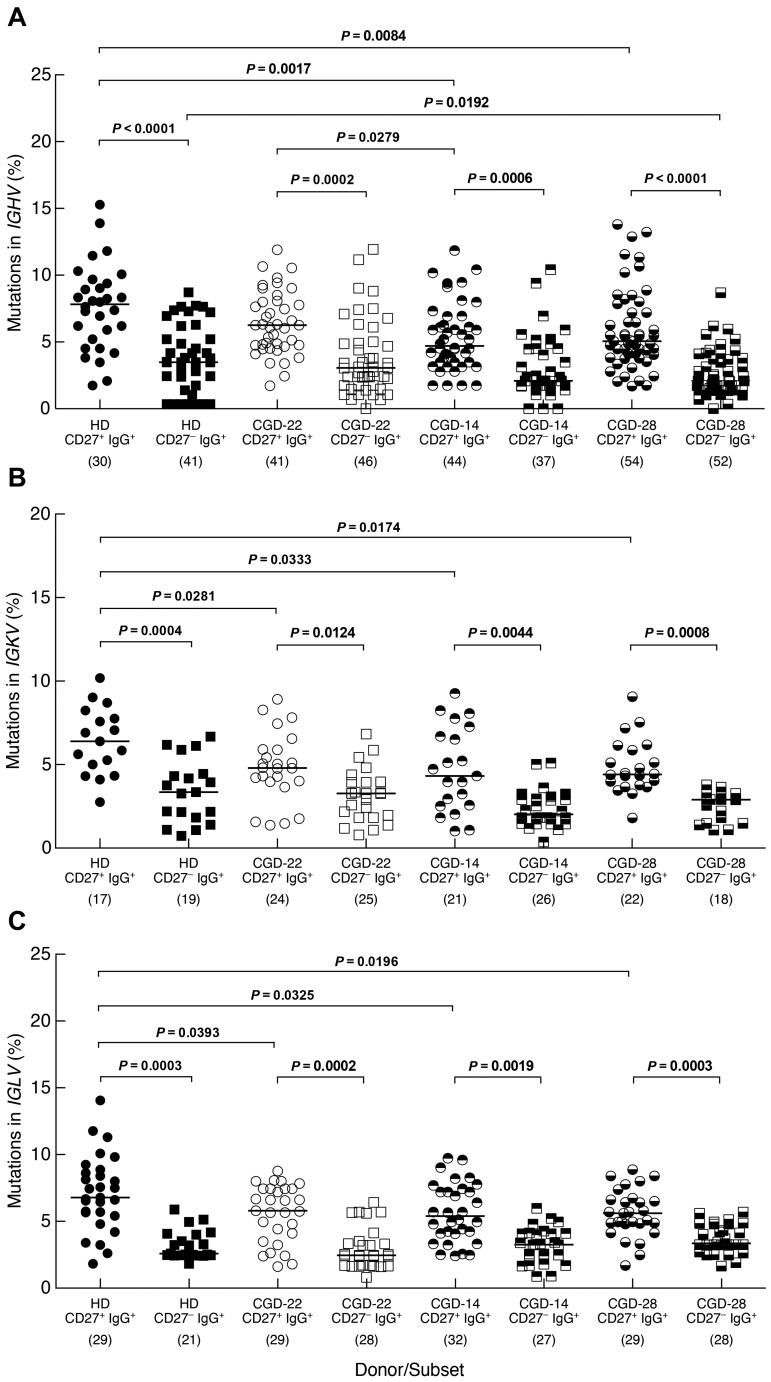
Figure 4.
Distinct SHM profiles for memory CD27−IgG+ and CD27+IgG+ B cells. The CD19+/CD3− cells of PBMCs from one HD and 3 CGD patients were sorted into CD27−IgG+ and CD27+IgG+ fractions and mutation frequencies were calculated for (A) IGHV, (B) IGKV, and (C) IGLV genes of each fraction. The number of clones sequenced from each subset/donor is shown in parentheses below the graphs. Numbers in the CGD identifiers below the graphs correspond to the patients studied (Table 1). Horizontal bars represent medians.

