Figure 4.
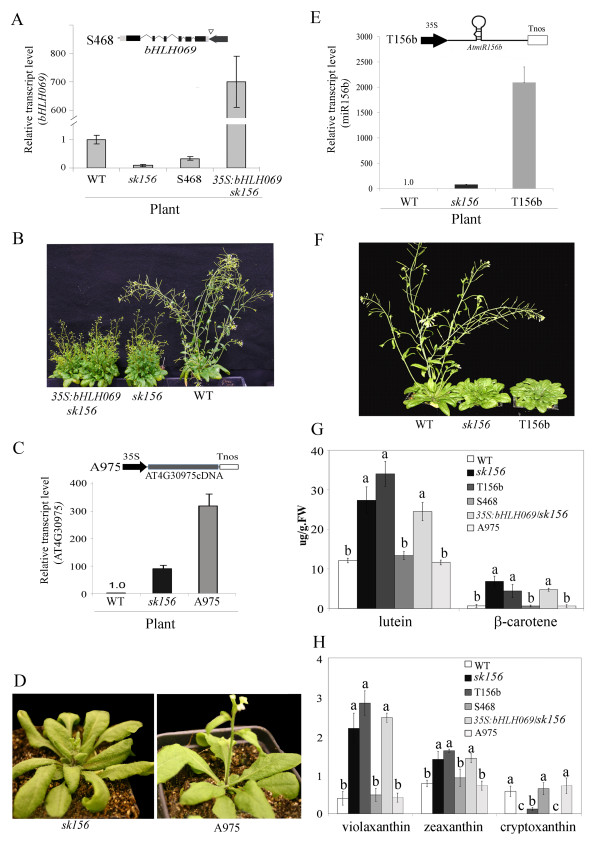
Involvement of miR156b, bHLH069, and the unknown RNA AT4G30975 in the phenotypes of the sk156 mutant. (A) Transcript levels of bHLH069 in WT (set at 1), sk156, mutant line S468 (SALK_032468), and in sk156 transformants complemented with a 35S:bHLH069 construct relative to WT (set at 1). Insert, schematic of T-DNA insertion site (triangle) in bHLH069 (AT4G30980) in S468 shows above. Exons (black boxes), untranslated regions (light grey boxes), promoter direction (dark arrow). (B) Morphology of 45-d-old transgenic sk156 complemented with 35S:bHLH069. Sk156, and WT plants are also shown. (C) Transcript levels of unknown RNA gene AT4G30975 in WT (set at 1), sk156, and 35S:AT4G30975cDNA-complemented sk156 (A975) plants. Schematic of AT4G30975 expression construct shows above. (D) Morphology of 35-d-old transgenic plant A975 compared to sk156. (E) Transcript levels of miR156 in WT, sk156, and 35S:miR156b-complemented sk156 (T156b) plants. Schematic of 35S:miR156b expression construct shows above. (F) Morphology of 40-d-old transgenic plants from sk156 and 35S:miR156b-over-expressing T156b lines compared to WT. (G) and (H) Seed carotenoid levels in sk156, T156b, A975, S468, 35S:bHLH069/sk156, and WT plants. A Duncan's multiple range test showed significant differences of the means (± standard deviation) compared to WT at p < 0.05. Means containing the same letter for the same compounds are not significantly different.

